
Fig. 3. Binding of NxCCaM or NCxCaM to BSCaMIQ.
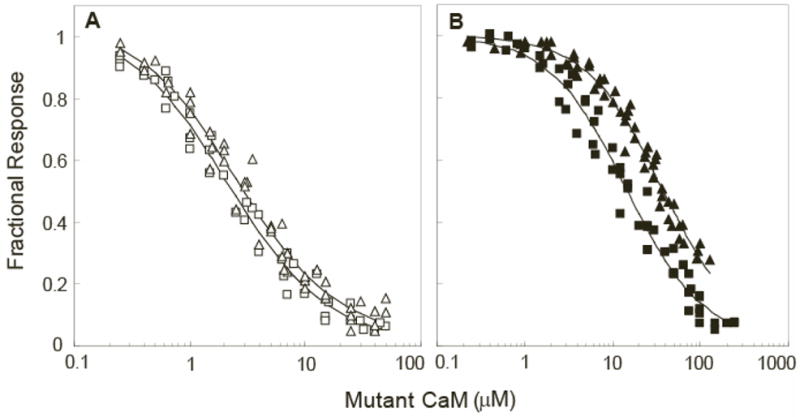
(A) Fractional changes in 525 nm fluorescence emission, defined as described in the legend to Fig. 2, associated with binding of NxCCaM (□) or NCxCaM (△) to 50 nM BSCaMIQ under nominally Ca2+ free conditions (3 mM BAPTA). (B) Fractional changes in 525 nm fluorescence emission associated with binding of NxCCaM (■) and NCxCaM (▲) to 150 nM BSCaMIQ at a free Ca2+ concentration of ~250 μM. Apparent Kd values derived from the data presented in panels A and B are listed in Table 1.