Abstract
Ninety-seven patients with 99 total knee arthroplasties were operated on by a surgeon in the first 3 years of his surgical career. Complete survival data were available for all 99 knees. The cases were reviewed at a minimum of 10 years after their initial operation, but as 37 patients had died before reaching 10 years, the average follow-up was 8 years 8 months with a maximum of 12 years 4 months. Ninety-one patients had osteoarthritis, five had rheumatoid arthritis, and three had juvenile chronic arthritis. No patients were lost to follow-up. Four required revision. The 10-year survival rate, using revision for all causes as an end-point, was 94.96%. The survival rate for aseptic loosening was 97.04%. The survival rate for loose joints that had not been revised was 94.13%. Three of the four revisions occurred in the first 6 patients operated upon, suggesting there may be a learning curve for surgeons at this stage in their career.
Résumé
Quatre-vingt-dix-sept patients ayant bénéficié de 99 prothèses totales du genou mises en place par un seul chirurgien lors de ces trois premières années d’activité. Toutes les données ont été récoltées pour ces 99 genoux. Ces patients ont été revus avec un minimum de 10 ans après l’intervention. Trente-sept étaient décédés. Le suivi moyen était de 8 ans 8 mois avec un maximum de 12 ans 4 mois. Quarante-vingt-onze patients avaient été traités pour arthrose, 5 pour arthrite rhumatoïde et 3 pour arthrite rhumatoïde juvénile, maladie de Still-Chauffard. Aucun patient n’a été perdu de vue. Quatre ont nécessité une reprise chirurgicale. Le taux de révision à 10 ans en prenant comme contrôle la révision quelle que soit la cause a été de 94.96%, le taux de survie pour descellement aseptique de 97.04%. Le taux de survie pour les patients qui n’ont pas été repris a été de 94.13%. Trois des quatre révisions sont survenues chez les six premiers patients opérés par le chirurgien et faisaient partie de la courbe d’apprentissage.
Introduction
Experience is an important factor in obtaining a satisfactory result in arthroplasty surgery, with surgeons undertaking less than 20 knee replacements per annum having lower post-operative physical composite scores in their patients than those undertaking greater numbers [5]. An inexperienced surgeon has double the dislocation rate in hip arthroplasty [6]. However, there are few published data on the outcome of knee arthroplasty undertaken by surgeons at the start of their practice [7, 13]. Hence, we assessed the 10-year survival of the first 99 press fit condylar (PFC) total knee arthroplasties (DePuy International Ltd., Leeds, UK) undertaken by a surgeon in a single hospital setting. We used survival curve analysis, with strict definitions regarding end-points, and evaluated a number of different end-point criteria to assess the outcome.
Patients and methods
Between 1990 and 1993, 97 patients underwent 99 total knee arthroplasties by the senior author (VR) in a dedicated orthopaedic hospital. He was at the start of his surgical practice, having completed the appropriate training for that time. Prior to these 99 knee replacements, he had undertaken four PFC knee replacements with assistance. The procedures were undertaken consecutively and have been numbered sequentially in order of surgery.
There were 35 males and 64 females with an average age of 69 years 10 months (range 24–88 years) at the time of surgery. Two patients had bilateral surgery undertaken separately. Ninety-one patients had osteoarthritis, five had rheumatoid arthritis and three JCA.
All procedures were undertaken in laminar flow theatres using body suits, routine prophylactic antibiotics, tourniquet and the use of a medial parapatellar arthrotomy. The patella was resurfaced with the exception of one patient who had had a previous patellectomy. A cruciate-preserving posterior-lipped implant was used and components cemented using CMW I gentamicin-loaded cement (DePuy International Ltd., Leeds, UK). The post-operative regimen included plaquenil and TED stockings for thromboprophylaxis and splintage in extension with physiotherapy-led flexion exercises from day 5.
Assessment
Patients were examined at 3 months, 1, 2, 5, 7 and 10 years, with a standard weight-bearing antero-posterior and lateral X-ray at each clinic attendance. Loosening of the arthroplasty was assessed using the Knee Society Roentgenographic Evaluation System (KSRES). This system scores radiological loosening in a knee arthroplasty separately for the femoral, tibial and patella components, which are summed to give a total score. A total score of four or less and non-progressive is rated as ‘probably not significant’, a total score of five to nine should be ‘followed for progression’, and a total score of ten or above signifies ‘possible or impending failure regardless of symptoms [4]’.
Survival analysis
Survival analysis was calculated using life tables as described by Armitage [1]. Confidence intervals of 95% were calculated via the Rothman method as described by Murray [16].
Survival curves for five criteria were analysed to assess revision for any cause, aseptic loosening and radiological loosening, assuming that patients with a KSRES score of greater than ten had failed at the time their score reached that level. Some patients were unable to return for a final X-ray due to incapacity, although their clinical outcome was known. To account for possible further radiological loosening in the absence of clinical features, the survival curves were re-calculated assuming the patients withdrew at the time of their last X-ray and hence had an overall shorter follow-up period. Survival analysis assumes patients ‘lost to follow-up’ fail at the same rate as other patients. This may not be the case and hence a ‘worst case scenario’ was calculated assuming all ‘lost to follow-up’ patients failed in the year of their withdrawal.
Results
Complete survival data were reviewed for all 99 knees at a minimum of 10 years post-operatively. As 37 patients had died before reaching 10 years, the average clinical follow-up was 8 years 8 months (range of 6 months to 12.33 years). None died as a direct result of their surgery. The mean radiological follow-up was 6 years 4 months, as some patients were unable to attend for X-ray due to incapacity or other on-going medical problems. These patients were contacted and interviewed by telephone.
Clinical data
Twenty-one patients had a valgus knee (mean of 9 degrees and a maximum of 40 degrees); 40 patients had a varus knee (mean of 6 degrees and a maximum of 40 degrees), and the remaining patients were neutral. Forty patients had a fixed flexion deformity with a mean of 4 degrees and a maximum of 30 degrees. The post-operative flexion increased from an average of 83 degrees to 90 degrees with the average post-operative arc of movement increasing from 74 to 85 degrees.
Implant data
A full range of implant sizes were used, with the most common being femoral size 3, tibial size 3 and patella size 38. Fifty-four knees required an 8-mm insert, which was the standard sized insert at the time. Thirty-two required a 10-mm insert, and the rest were equally divided between 12.5 mm and 15 mm inserts.
Knee society roentgenographic evaluation system
The average score for all three components, as well as the total score, was less than four, which is defined as ‘probably non-significant.’ Ninety knees scored less than four, three scored between five and ten and six scored over ten. These latter six included the four knees that required revision and two that did not. The full results are shown in Table 1.
Table 1.
Knee society roentgenographic evaluation system [4]
| Femur | Tibia | Patella | Total | |
|---|---|---|---|---|
| Average | 1.3 | 0.7 | 0.2 | 2.2 |
| Std deviation | 2.6 | 1.9 | 1.7 | 5.1 |
Complications
Seventy-eight patients had no complications from their surgery. One patient had a laterally subluxed patella on X-ray with no functional disturbance and required no surgical intervention. One patient had an avulsion fracture of their patella following a fall within a year of surgery. The patella implant showed no loosening, but the patient died just under 3 years post-operatively.
Two patients required revision due to deep sepsis. A third patient attended a separate hospital with a septic arthrosis 1 year after surgery. The knee was arthroscopically debrided and he was given a prolonged course of antibiotics. His knee shows radiological loosening (KSRES score = 13), but he is symptom free and is being monitored. Seven patients had a superficial wound infection requiring antibiotics. Other complications included deep vein thrombosis in three patients and the necessity for a manipulation in two patients.
Revision surgery
Four patients required revision surgery-two for sepsis and two for aseptic loosening. Three of the four were amongst the first six of the patients operated on and were revised at 1 year, 1 year and 9 years, respectively. The forth was revised at 5 years.
Patient 4 was on warfarin. He had a wound infection at 2 weeks post-operatively and further infection required debridement of the knee at 7 months. He had the first of a two-stage revision at 15 months. The causative organisms were group B streptococcus and coagulase negative staphylococcus. He declined the second stage, but returned at 8 years with pain and had a hinged prosthesis inserted. Further infection necessitated an above knee amputation.
Patient 5 had a wound infection within a month of surgery. Group G streptococcus was grown. Revision surgery was recommended at 1 year, but he died from other causes before surgery was undertaken.
Patient 6 had risk factors of obesity and smoking. He first complained of pain at 8 years and was revised for aseptic loosening in his 9th year. All components were loose at surgery with wear in the postero-lateral part of the insert. He is doing well 2 years post-revision.
Patient 98 had gross varus of 40°. The medial tibial condyle was absent and was filled with structural autologous bone graft held with a screw. Shift in the prosthesis required revision in the 5th year to a linked prosthesis. Both femoral and tibial components were loose, but the patella was well fixed. He is doing well 3 years post-revision.
Survival analysis
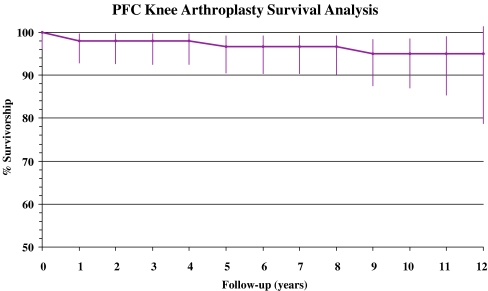
Using revision, for any reason, as the end-point and including the patient who died before revision surgery, the 10-year survival rate was 94.96% (95% confidence limits: 98.56-87.02). These are shown in Fig. 1 and Table 2.
Fig. 1.
Survival analysis with revision for any reason as end-point
Table 2.
Life table for survival analysis
| Follow-up (years) | Number at start | Withdrawn | Failure | Lost to follow-up | Number at risk | Cumulative success rate | Annual success | Effective no. at risk | 95% confidence levels | Confidence diff. | ||
|---|---|---|---|---|---|---|---|---|---|---|---|---|
| Upper | Lower | Upper | Lower | |||||||||
| 0 | 99 | 1 | 0 | 0 | 98.5 | 100.00 | 100.00 | 98.50 | 100.15 | 96.25 | 0.15 | 3.75 |
| 1 | 98 | 1 | 2 | 0 | 97.5 | 97.95 | 97.96 | 98.00 | 99.64 | 92.79 | 1.69 | 5.16 |
| 2 | 95 | 7 | 0 | 0 | 91.5 | 97.95 | 100.00 | 95.73 | 99.65 | 92.70 | 1.70 | 5.25 |
| 3 | 88 | 3 | 0 | 0 | 86.5 | 97.95 | 100.00 | 93.24 | 99.67 | 92.59 | 1.72 | 5.35 |
| 4 | 85 | 4 | 0 | 0 | 83 | 97.95 | 100.00 | 91.00 | 99.69 | 92.50 | 1.74 | 5.45 |
| 5 | 81 | 2 | 1 | 0 | 80 | 96.70 | 98.77 | 88.96 | 99.15 | 90.56 | 2.45 | 6.14 |
| 6 | 78 | 7 | 0 | 0 | 74.5 | 96.70 | 100.00 | 86.56 | 99.18 | 90.44 | 2.48 | 6.26 |
| 7 | 71 | 4 | 0 | 0 | 69 | 96.70 | 100.00 | 83.89 | 99.21 | 90.30 | 2.51 | 6.40 |
| 8 | 67 | 3 | 0 | 0 | 65.5 | 96.70 | 100.00 | 81.35 | 99.24 | 90.16 | 2.54 | 6.54 |
| 9 | 64 | 13 | 1 | 0 | 57.5 | 94.96 | 98.44 | 78.11 | 98.41 | 87.53 | 3.45 | 7.43 |
| 10 | 50 | 26 | 0 | 0 | 37 | 94.96 | 100.00 | 70.95 | 98.56 | 87.02 | 3.60 | 7.94 |
| 11 | 24 | 17 | 0 | 0 | 15.5 | 94.96 | 100.00 | 54.65 | 99.02 | 85.46 | 4.06 | 9.50 |
| 12 | 7 | 7 | 0 | 0 | 3.5 | 94.96 | 100.00 | 25.73 | 101.37 | 78.81 | 6.41 | 16.15 |
Aseptic loosening
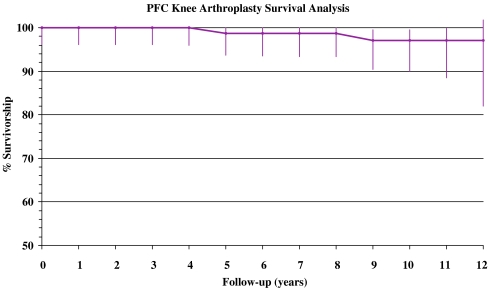
Two of the revisions were for aseptic loosening. Using this criterion as the end-point, the 10-year survival rate was 97.04% (95% confidence limits: 99.54-90.00). This is shown in Fig. 2.
Fig. 2.
Survival analysis for aseptic loosening
Radiological loosening
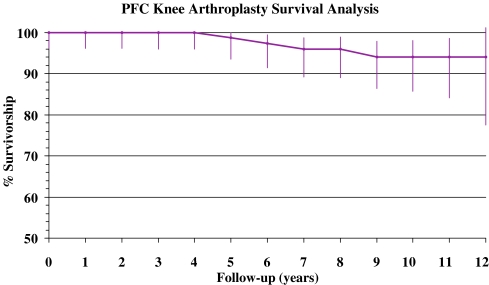
Other than the four patients who were revised, two others had a KSRES score of greater than ten. Neither was listed for surgery. The 10-year survival rate with this as the end-point criteria was 94.13% (95% confidence limits: 98.14-85.79). Details are shown in Fig. 3 and Table 3.
Fig. 3.
Survival analysis for radiological loosening-endpoint is re-operation for any reason or KSRES>10
Table 3.
KSRES>10
| Pat. no. | Age | Diag. | KSRES Score | Year score >10 | Current F/U | Comments | |||
|---|---|---|---|---|---|---|---|---|---|
| Femur | Tibia | Patella | Total | ||||||
| 31 | 66 | O/A | 6 | 5 | 0 | 11 | 7 | 11 years 2 months | Varus 25° medial bone grafting |
| 63 | 64 | O/A | 1 | 5 | 7 | 13 | 6 | 10 years 11 months | Septic arthrosis at 1 year |
Withdrawal at last X-ray
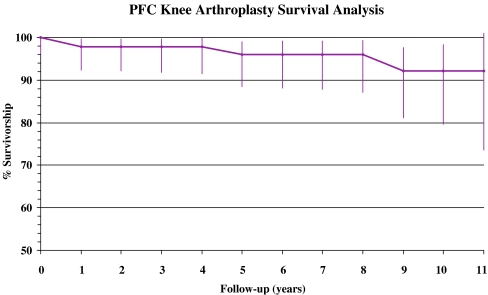
Survival data were recalculated for patients who had not had an up-to-date X-ray. Using this criterion the 10-year survival rate was 92.09% (95% confidence limits: 98.33-79.54). This is shown in Fig. 4.
Fig. 4.
Survival analysis with revision for any reason as end-point and withdrawl at last X-ray
Worst case scenario
No patients were ‘lost to follow-up’, and hence the worst case scenario should be the 92.09% calculated from ‘withdrawal at last X-ray’, but the higher value of 94.13% calculated from those with impending radiological failure is likely to be more accurate.
Discussion
Surgeons embark on a learning curve when undertaking a new procedure that varies amongst surgeons and the procedure that they are undertaking. There is evidence that trainee surgeons have poorer results and increased complications than consultant surgeons more familiar with the operative technique. This also may be the case with less experienced consultant surgeons [2, 5–7, 11]. However, Mahaluxmivala measured the radiological positioning of 673 PFC total knee arthroplasties and found no significant differences between consultants and trainees, so the argument is not clear cut [13]. Although the medium- and long-term results of knee arthroplasty are well published, details of survivorship in knee arthroplasty for surgeons at the start of their practice is important for consent reasons [12].
Certain criteria are required to ensure accurate, reproducible results in survival analysis. These include strict definitions regarding end-points: that a number of different end-point criteria are evaluated, that a worst-case scenario is presented, that ‘lost to follow-up’ data are presented and accounted for, and that the quoted year for survival rate contains enough patients to allow statistical validity. A life table allows the display of details such as patients lost to follow-up and the number of failures. It allows success rates and the confidence intervals to be determined and displayed more readily. Hence, it has advantages over product limit methods such as Kaplan-Meier [1, 8, 10, 15, 16].
The 10-year survival for total knee arthroplasty, using revision surgery as an endpoint, is over 92% for a number of well-established prostheses [2, 3, 11, 17, 19]. With the PFC system, using revision surgery as an endpoint, Schai reports 90% 10-year survival; Khaw reports 95.5% 10-year survival, and also 95.3% and 95.6% for cemented and cementless fixation respectively at 10 years. Martin reported an overall complication rate of 2.9% in 378 PFC knees between 5 and 9 years [9, 10, 14, 18].
The overall 10-year survival in this cohort is 94.96%, which is in line with the published data [2, 3, 9–11, 14, 17–19]. It is encouraging that surgeons in the early stages of their careers can achieve such results; however, there are a number of factors that determine the success of a prosthesis, including the surgeon’s skill as well as the implant design. In this hospital, patients were reviewed by a number of surgeons at a clinical conference. Hence, this case mix may represent a higher number of ‘easier cases’, as more ‘difficult’ cases may have been operated on by more senior surgeons. Therefore, it cannot be concluded that all surgeons at this stage would achieve the same results even using the same prosthesis. It is important to note that three of the four revisions occurred within the first six patients with two revised within a year, but the third at 9 years. This suggests there may be a steep learning curve that surgeons embark upon, but this cannot be statistically proven. What is difficult to assess is how the ‘learning curve’ of one implant affects the ‘learning curve’ for a different implant. Despite the surgeon only undertaking four PFC knees prior to this cohort, did his previous training place him further along the learning curve? It is not until formal survival analysis is undertaken, using a number of separate criteria, that a true refection of success can be gauged.
One criticism of survival analysis is the exclusion from the results of patients who are failing radiologically or clinically, but who do not undergo surgery. These may be elderly or infirm patients who choose or are advised not to undergo revision surgery even in the presence of symptoms. This results in a falsely high survival rate. Hence, survival analysis based on radiological assessment is important to quantify impending failure. Two patients had radiological loosening as defined by a KSRES score greater than ten and both are likely to require revision. Recalculating data to account for patients who have not had up-to-date X-rays as well as those who were radiological failures (92.09% and 94.13% respectively in this series) gives an important survivorship rate.
Although septic loosening can be iatrogenic in nature, it may slightly mask the surgical ability to implant a successful prosthesis. Aseptic loosening of an established prosthesis, however, is a good indicator of surgical technique. Hence, we feel it is important to record survival analysis for this separately. The 10-year survival rate of 97.04% is as good as most published data [2, 9, 17–19].
There is debate over whether ‘lost to follow-up’ matters. Murray argues that patients ‘lost to follow-up’ have a worse outcome than those who continue to be assessed, hence producing falsely optimistic results. A worse case scenario curve should be constructed assuming all ‘lost to follow-up’ patients have failed [15]. Joshi disagreed with this conclusion, and tracked down and re-assessed all 123 ‘non-attenders’ of a cohort of 440 total knee replacements. He found ‘non-attenders’ showed no significant difference to ‘attenders’ with regard to survival rates for revision surgery and pain [8]. We had no patients ‘lost to follow-up’, but feel these should be presented as failures at the point they were lost to calculate the worst case scenario.
There are weaknesses in this paper. We have only presented survival analysis with radiological review. There are no outcome scores such as SF-12 or WOMAC, as these were not recorded at the time of the operations. Survival rates reflect two main factors-the skill of the surgeon and the design of the prosthesis-although there are other factors responsible for a ‘good’ outcome. Survival percentages need to be carefully assessed according to what they are actually representating. A series of figures representing well-defined criteria, rather than just a single time-frame survival percentage, gives a better indication of ‘true’ survivorship. As three of the four revisions occurred in the first six patients in the series, this suggests there may be a learning curve that a surgeon undergoes early in his or her career, although this cannot be statistically proven. However, it is therefore encouraging that the overall survival rates are in line with other published data, although the total numbers are smaller. The results lend weight to the argument that patients need to be fully informed as to the experience of the surgeon and changes in prosthesis types and design.
Acknowledgments
We would like to thank Paul Siney for his help with this survival analysis. AS/VR 2007.
No benefits or funds were received in support of the study. AJAS/VR 2007.
References
- 1.Armitage P, Berry G (1994) Statistical methods in medical research, 3rd edn. Blackwell Scientific Publications, Oxford
- 2.Back DL, Cannon SR, Hilton A, Bankes MJ, Briggs TW (2001) The kinemax total knee arthroplasty. Nine years’ experience. J Bone Joint Surg (Br) 83-B(3):359–363 [DOI] [PubMed]
- 3.Emmerson KP, Moran CG, Pinder IM (1996) Survivorship analysis of the kinematic stabilizer total knee replacement: a 10–14 year follow-up. J Bone Joint Surg 78-B:441–445 [PubMed]
- 4.Ewald FC (1989) The knee society total knee arthroplasty roentgenographic evaluation and scoring system. Clin Orthop 248(9):9–12 [PubMed]
- 5.Heck DA, Robinson RL, Partridge CM, Lubitz RM, Freund DA (1998) Patient outcomes after knee replacement. Clin Orthop 356:93–110 [DOI] [PubMed]
- 6.Hedlundh U, Ahnfelt L, Hybbinette C-H, Weckström J, Fredin H (1996) Surgical experience related to dislocations after total hip arthroplasty. J Bone Joint Surg (Br) 78-B(2):206–209 [PubMed]
- 7.Jolles BM, Zangger P, Leyvraz P-F (2002) Factors predisposing to dislocation after primary total hip arthroplasty. J Arthroplasty 17(3):282–288 [DOI] [PubMed]
- 8.Joshi AB, Gill GS, Smith PL (2003) Outcome in patients lost to follow-up. J Arthroplasty 18(2):149–153 [DOI] [PubMed]
- 9.Khaw FM, Kirk LM, Gregg PJ (2001) Survival analysis of cemented press-fit condylar total knee arthroplasty. J Arthroplasty 16(2):161–167 [DOI] [PubMed]
- 10.Khaw FM, Kirk LM, Morris RW, Gregg PJ (2002) A randomised, controlled trial of cemented versus cementless press-fit condylar total knee replacement. Ten-year survival analysis. J Bone Joint Surg (Br) 84-B(5):658–666 [DOI] [PubMed]
- 11.Li PL, Zamora J, Bentley G (1999) The results at ten years of the insall-Burstein II total knee replacement. Clinical, radiological and survivorship studies. J Bone Joint Surg (Br) 81-B(4):647–653 [DOI] [PubMed]
- 12.Liow RW, Murray DW (1997) Which primary total knee replacement? A review of currently available total knee replacements in the United Kingdom. Ann R Coll Surg Eng 79:335–340 [PMC free article] [PubMed]
- 13.Mahaluxmivala J, Bankes MJ, Nicolai P, Aldam CH, Allen PW (2001) The effect of surgical experience on component positioning in 673 press fit condylar posterior cruciate-sacrificing total knee arthroplasties. J Arthroplasty 16(5):635–640 [DOI] [PubMed]
- 14.Martin SD, McManus JL, Scott RD, Thornhill TS (1997) Press-fit condylar total knee arthroplasty. Five to 9 year follow-up evaluation. J Arthroplasty 12(6):603–614 [DOI] [PubMed]
- 15.Murray DW, Britton AR, Bulstrode CJK (1997) Loss to follow-up matters. J Bone Joint Surg (Br) 79-B(2):254–257 [DOI] [PubMed]
- 16.Murray DW, Carr AJ, Bulstrode C (1993) Survival analysis of joint replacements. J Bone Joint Surg (Br) 75-B(5):697–704 [DOI] [PubMed]
- 17.Nafei A, Kristensen O, Knudsen HM, Jenson J (1996) Survivorship analysis of cemented total condylar knee arthroplasty: a long-term follow-up report on 348 cases. J Arthroplasty 11(1):7–10 [DOI] [PubMed]
- 18.Schai PA, Thornhill TS, Scott RD (1998) Total knee arthroplasty with the PFC system. Results at a minimum of ten years and survivorship analysis. J Bone Joint Surg (Br) 80-B(5):850–858 [DOI] [PubMed]
- 19.Weir DJ, Moran CG, Pinder IM (1996) Kinematic condylar total knee arthroplasty: 14-year survivorship analysis of 208 consecutive cases. J Bone Joint Surg 78-B:907–911 [DOI] [PubMed]


