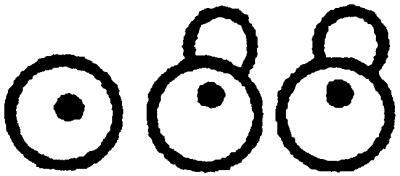
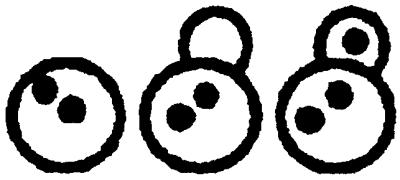
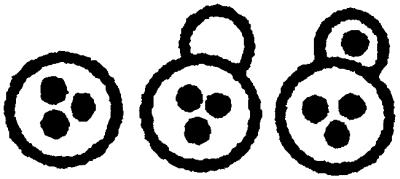
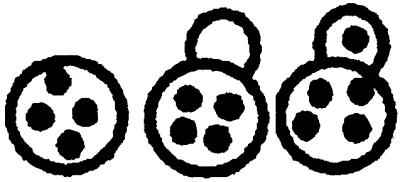
Table 1.
Nuclear migration in diploid cnm67Δ1 (ABY108)- and wild-type (CEN.PK2) strains
| Nuclear migration phenotype
|
||||||
|---|---|---|---|---|---|---|
 |
 |
 |
 |
 |
||
| Yeast strain | 0 Nucleus per cell | 1 Nucleus per cell | 2 Nuclei per cell | 3 Nuclei per cell | >3 Nuclei per cell | |
| 16°C | CNM67 | 0 % | 99.6% | 0.4% | 0 % | 0 % |
| cnm67Δ1 | 4.4% | 57.5% | 25.3% | 7 % | 5.8% | |
| 30°C | CNM67 | 0 % | 98 % | 2 % | 0 % | 0 % |
| cnm67Δ1 | 4.9% | 55.6% | 25.7% | 6.6% | 7.2% | |
| 37°C | CNM67 | 0.1% | 99.5% | 0.4% | 0 % | 0 % |
| cnm67Δ1 | 8.3% | 52.3% | 32.2% | 5.7% | 1.5% | |
The number of nuclei per cell in diploid yeast strains was determined by DAPI staining of asynchronous cultures in exponential growth phase. Greater than 500 cells were counted for each strain. Cells of different morphologies were grouped according to their nuclear distribution as indicated at the top.
