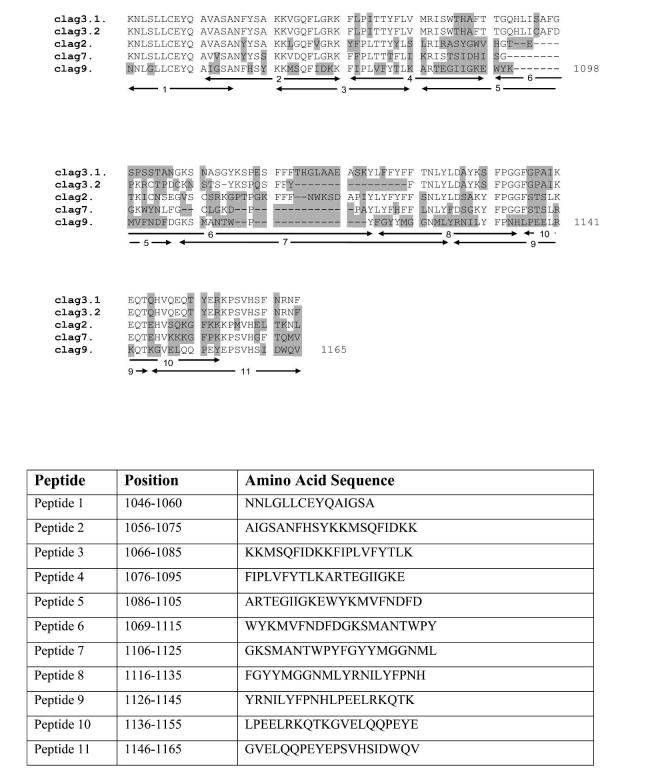
FIGURE 1.
Top, Alignment of peptides used in this study demonstrating lack of overlap with other cytoadherence-linked asexual genes. The numbers 1-11 indicate the position of each peptide. The highlighted regions represent non-conserved amino acid changes. Bottom, Amino acid sequence of peptides used in this study.

