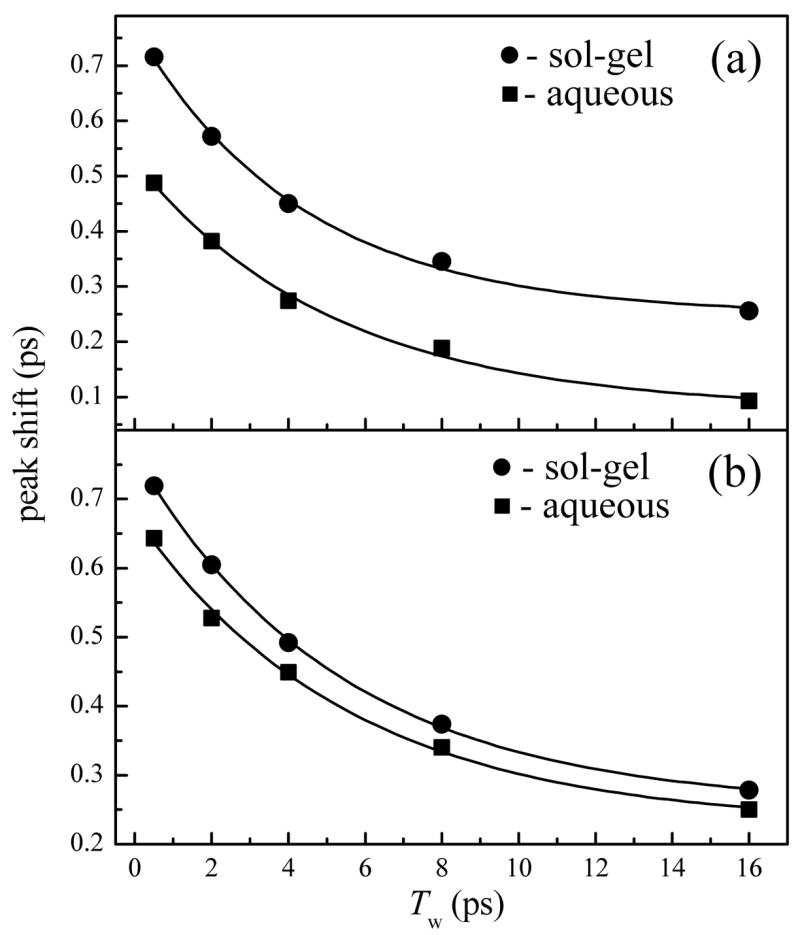
Figure 4.

Vibrational echo peak shifts as a function of Tw for a) MbCO and b) HbCO in aqueous and sol-gel encapsulated environments. In both frames, the filled squares represent the aqueous protein data and the filled circles represent the sol-gel encapsulated protein peak shifts. The solid lines represent single exponential fits to the data with time constants of a) 5.2 ± 0.7 and 4.4 ± 0.4 ps for aqueous and sol-gel encapsulated MbCO and b) 5.6 ± 0.7 and 5.4 ± 0.2 ps for aqueous and sol-gel encapsulated HbCO, respectively.
