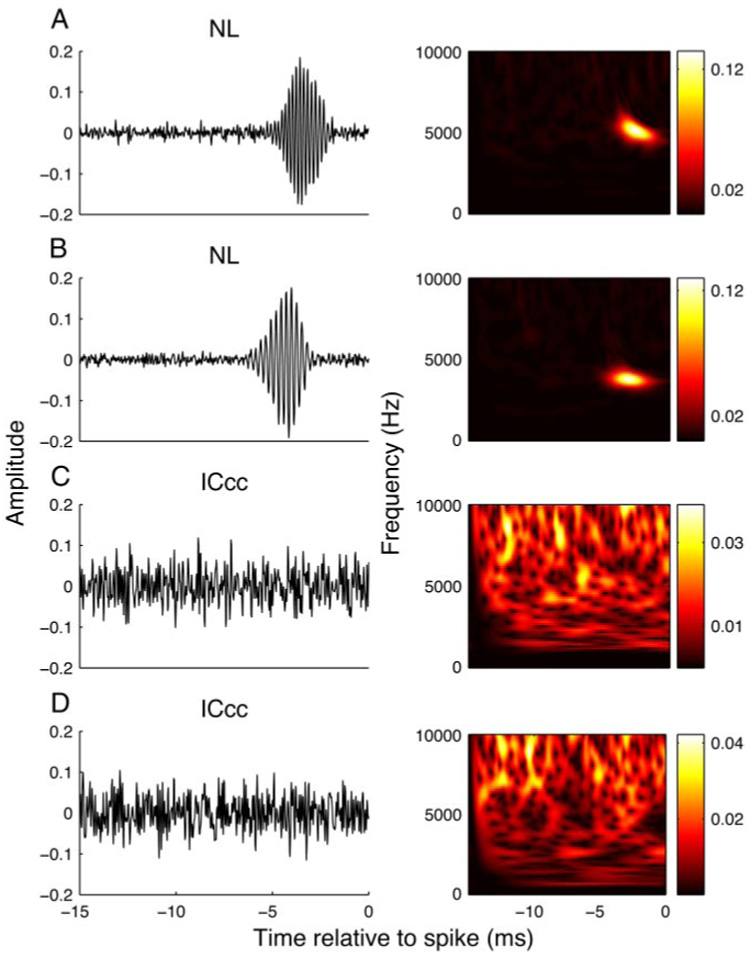
FIG. 1.

Examples of spike-triggered averages. Shown are examples of the spike-triggered averages of nucleus laminaris (NL; A, B, left column) and central nucleus of the inferior colliculus (ICcc; C, D, left column) neurons, along with their spectrograms (right column). Abscissa gives the time preceding the spike; color bars are provided for reference, but in the following figures will be omitted. A: 4,135 spikes; B: 4,983 spikes; C: 4,739 spikes; D: 4,835 spikes.
