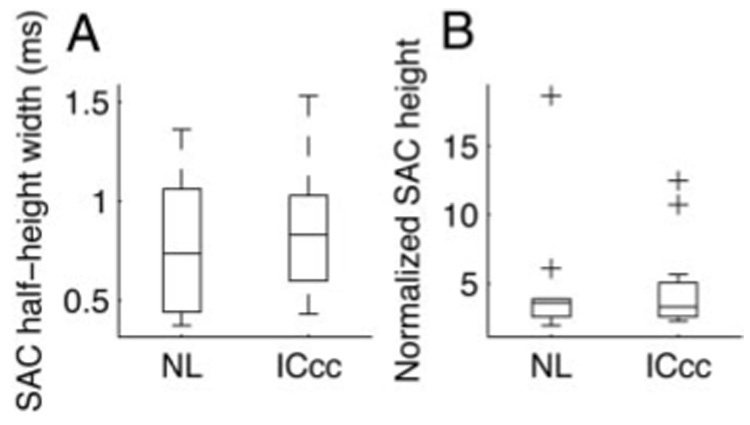
FIG. 3.

Variability in NL and ICcc. A: half-height widths of the SACs for NL and ICcc neurons. B: maximum height of the SACs for NL and ICcc neurons. Boxes extend from lower quartile to upper quartile of the sample, with the center line marking the median. Outliers (+) are data points >1.5-fold the interquartile range of the sample.
