
Figure 3.
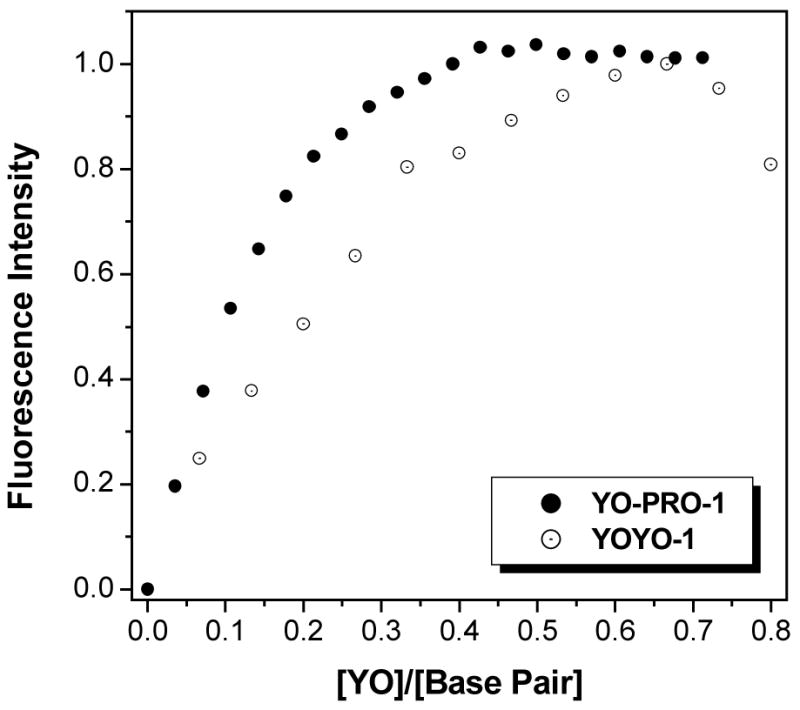
Dependence of maximum fluorescence intensity on ratio of intercalating YO groups per DNA base pair. [DNA] = 1 μM 3WJ = 30 μM base pairs for YO-PRO-1 and 0.1 μM 3WJ = 3.0 μM base pairs for YOYO-1. Spectra were recorded with excitation at 440 nm and data were normalized to the highest value at the emission wavelength (507 nm for YO-PRO-1, 510 nm for YOYO-1).