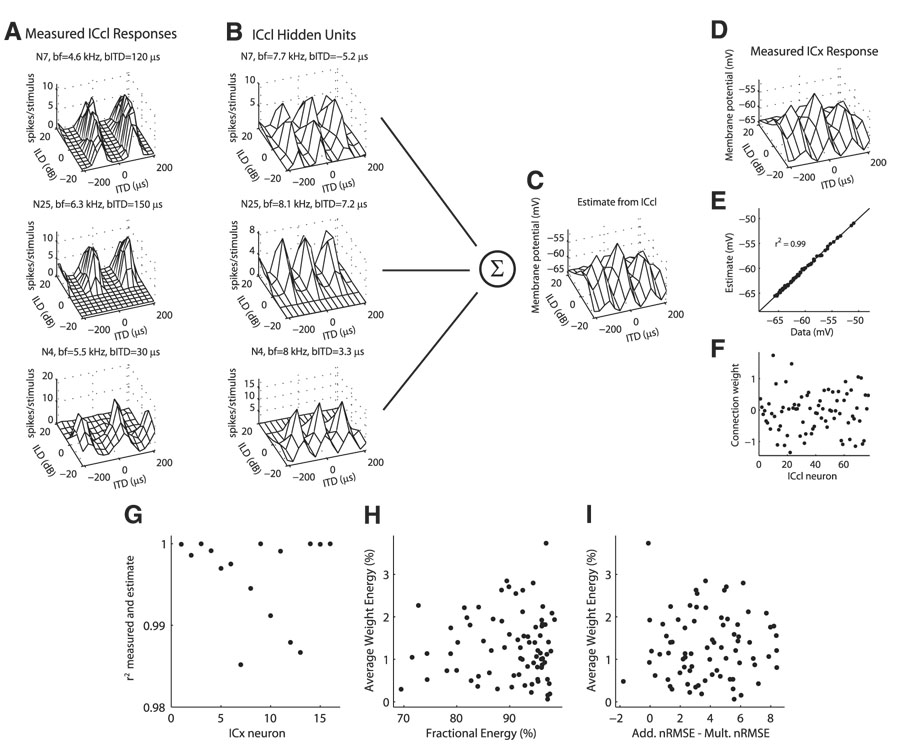
FIG. 10.
Estimate of the subthreshold response of external nucleus of the inferior colliculus (ICx) neurons from the spiking responses of ICcl neurons. A: examples of measured spiking responses of ICcl neurons to ITD and ILD. For each neuron, the best frequency (bf) and best ITD (bITD) are displayed, for comparison with the corresponding hidden layer units in B. B: hidden layer units corresponding to the neurons in A derived from a parametric fit to the measured response (see METHODS). Best frequency and best ITD of the hidden unit were modified to be consistent with the ICx unit in D, but the dependence of ITD tuning on ILD is the same as in the measured response. C: estimate of the ICx response in D from a linear combination of ICcl hidden unit responses using the weights plotted in F. E: correlation between the model estimate shown in C and the measured ICx data shown in D. G: squared correlation coefficients of the model estimate and the measured ICx data for 16 ICx neurons. ICx data are from Peña and Konishi (2001). H and I: energy in each ICcl unit’s connection weight , averaged over 16 ICx neurons plotted against the fractional energy in the first singular value of the singular value decomposition of the ITD–ILD response matrix (H) and the difference between the additive and multiplicative normalized RMS errors in the approximation to the ITD–ILD response matrix (I).

