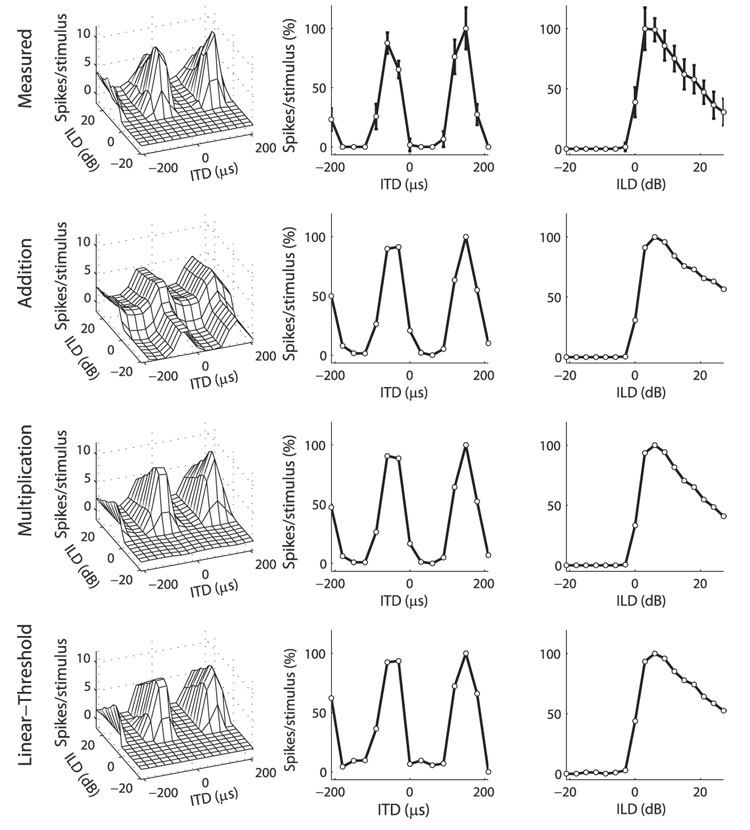
FIG. 2.
Example ICcl neuron where the multiplicative model fit the data better than did the additive model. Top row: ITD–ILD response matrix of an ICcl neuron (left column) along with its ITD and ILD tuning curves (center and right columns, respectively). Error bars represent the SD. Approximations to the data (left column) were formed by combining a function of ITD (center column) with a function of ILD (right column) either additively (2nd row), multiplicatively (3rd row), or using addition and a threshold (bottom row). ITD and ILD tuning curves of the data, as well as ITD and ILD model components, are plotted as the percentage of response height. Normalized root-mean-square (RMS) errors for the additive, multiplicative, and linear-threshold models were 13.95, 5.56, and 6.70%, respectively.

