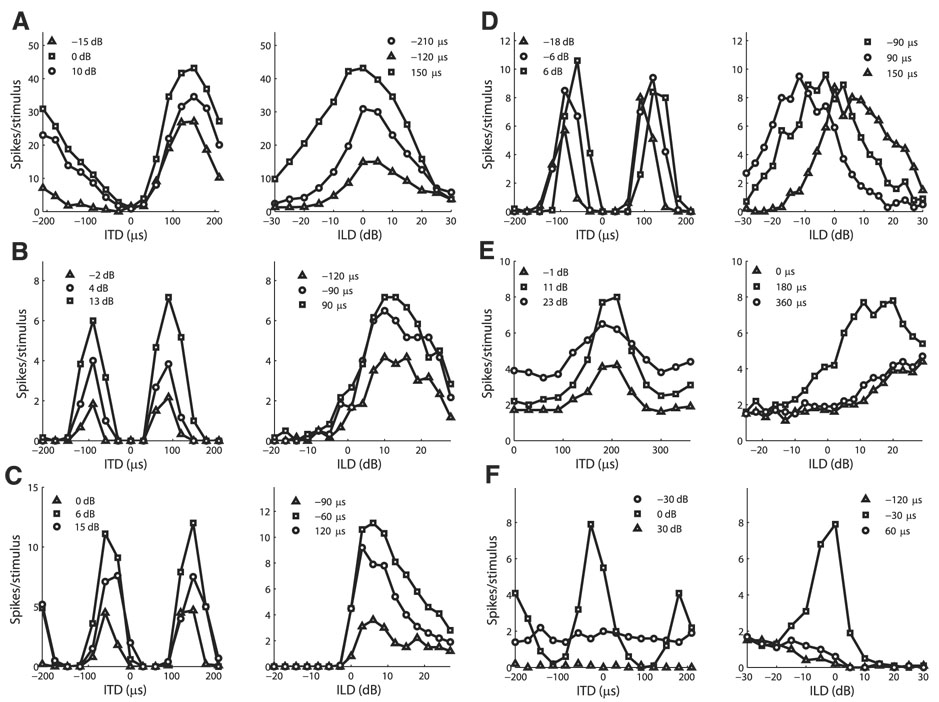
FIG. 6.
A–C: example neurons that qualitatively agree with the multiplicative model. Left column: ITD tuning curves at different ILDs. Right column: ILD tuning curves at different ITDs. Pairs in each row are for the same neuron. D–F: example neurons that show deviations from the multiplicative model. Example neurons show tuning curves that shift with the other variable (D), ITD tuning curves that differ by a constant bias (E), and ILD tuning curves that are peaked only for preferred ITD values (F).

