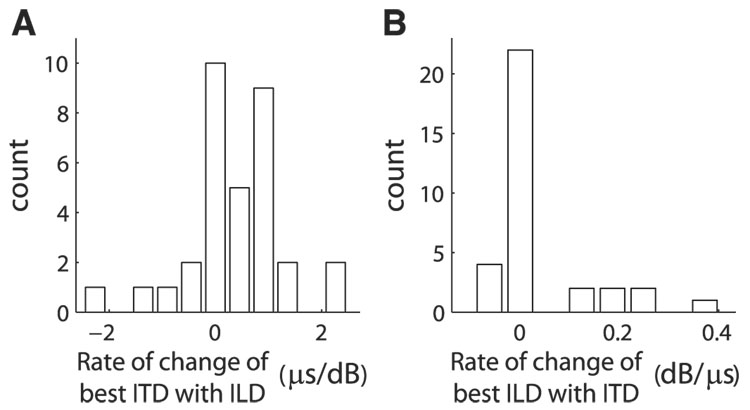
FIG. 7.
A: rate of change of best ITD with ILD. Rate of change is defined for neurons where there were at least 5 significant ITD tuning curves and the RMS error in the best linear fit to the change in best ITD with ILD was ≤30 µs (33/77; see METHODS). B: rate of change of best ILD with ITD. Rate of change is defined for neurons where there were at least 5 significant ILD tuning curves and the RMS error in the best linear fit to the change in best ILD with ITD was ≤6 dB (33/77; see METHODS).

