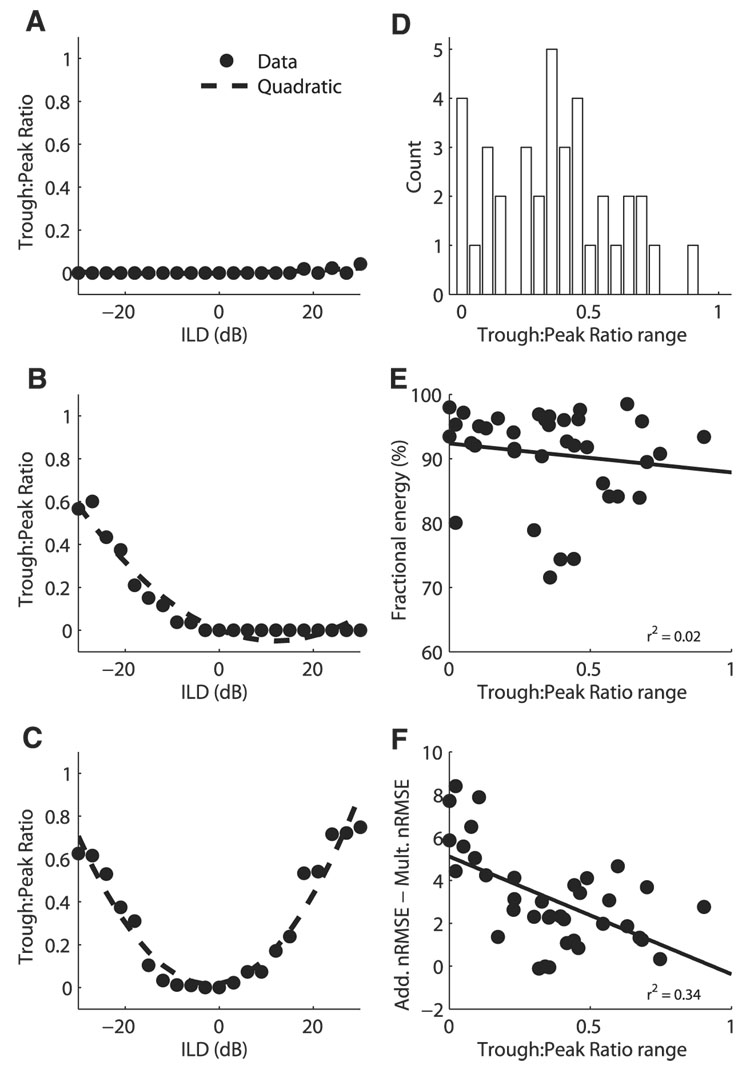
FIG. 8.
Trough:peak ratio of ITD tuning curves as a function of ILD. Trough:peak ratio for example neurons showing little variation with ILD (A), an increase at one end of the ILD range (B), and increases at both ends of the ILD range (C). Data are plotted along with the least-squares quadratic fit. Average RMS error in the quadratic fit over 37 neurons with at least 5 significant ITD tuning curves was 0.049 ± 0.043. D: difference between the maximum and minimum trough:peak ratios at different ILDs in individual neurons (n = 37). E and F: difference between the maximum and minimum trough:peak ratios at different ILDs plotted against the fractional energy in the first singular value of the singular value decomposition of the ITD–ILD response matrix (E) and the difference between the additive and multiplicative nRMS errors in the approximation to the ITD–ILD response matrix (F).

