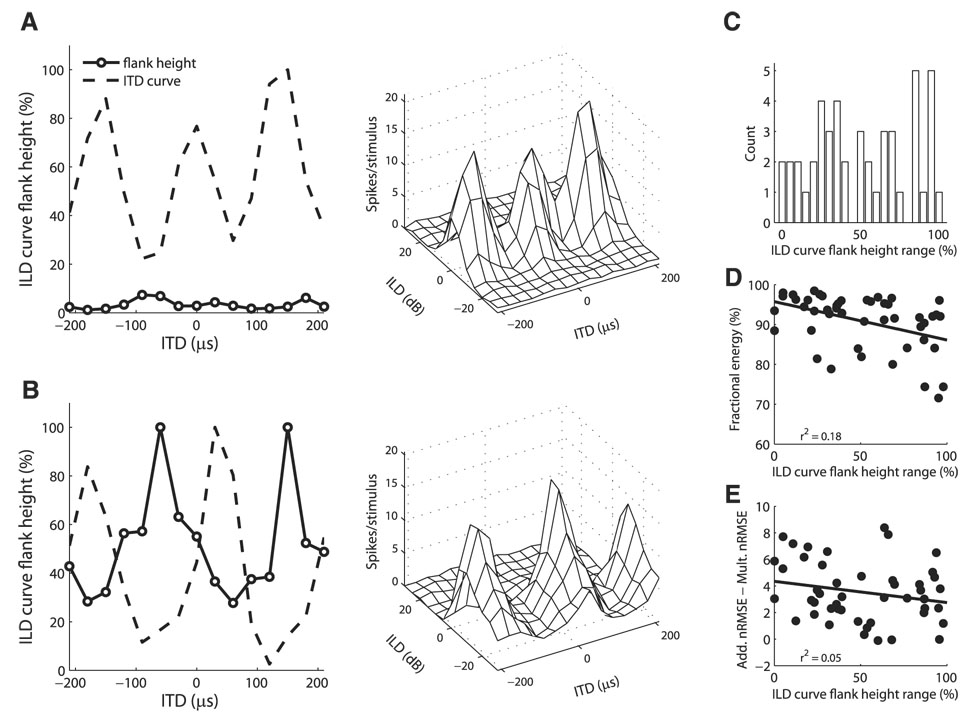
FIG. 9.
ILD tuning curve flank-height as a function of ITD. A: example neuron where the ILD tuning curve flank-height varied little with ITD. ITD–ILD response matrix (right) shows that the neuron had peaked ILD tuning for each ITD value. B: example neuron where the ILD tuning curve flank-height varied with ITD. Height of the ILD tuning curve flank was smallest for ITD values corresponding to peaks in the ITD curve. ITD–ILD response matrix (right) shows that the neuron had sigmoidal ILD tuning for nonpreferred ITD values and open-peaked ILD tuning for preferred ITD values. C: difference between the maximum and minimum ILD tuning curve flank-heights at different ITDs in individual neurons (n = 47). D and E: difference between the maximum and minimum ILD tuning curve flank-heights at different ITDs plotted against the fractional energy in the first singular value of the singular value decomposition of the ITD–ILD response matrix (D) and the difference between the additive and multiplicative nRMS errors in the approximation to the ITD–ILD response matrix (E).

