
Figure 3.
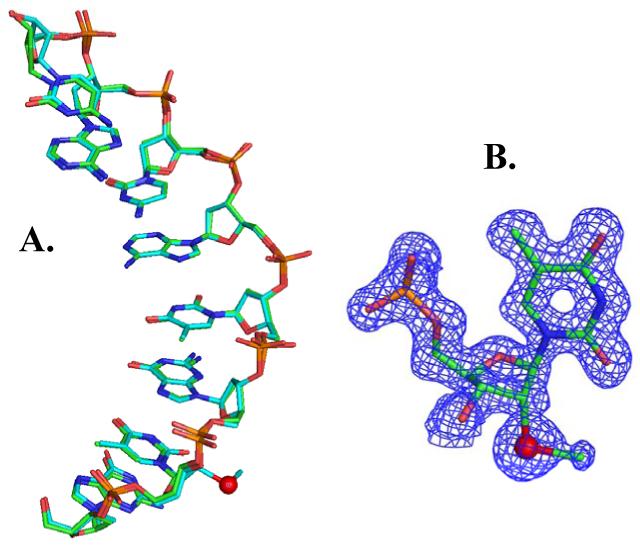
DNA crystal structures (Se in red). (A) Superimposed structure comparison of the native DNA (GTGTACAC, 1DNS in green) and the Se-derivatized DNA (GTSeGTACAC, 2HC7 in cyan). (B) The structure model and the electron density map of 2′-Se-ribothymidine in the structure.