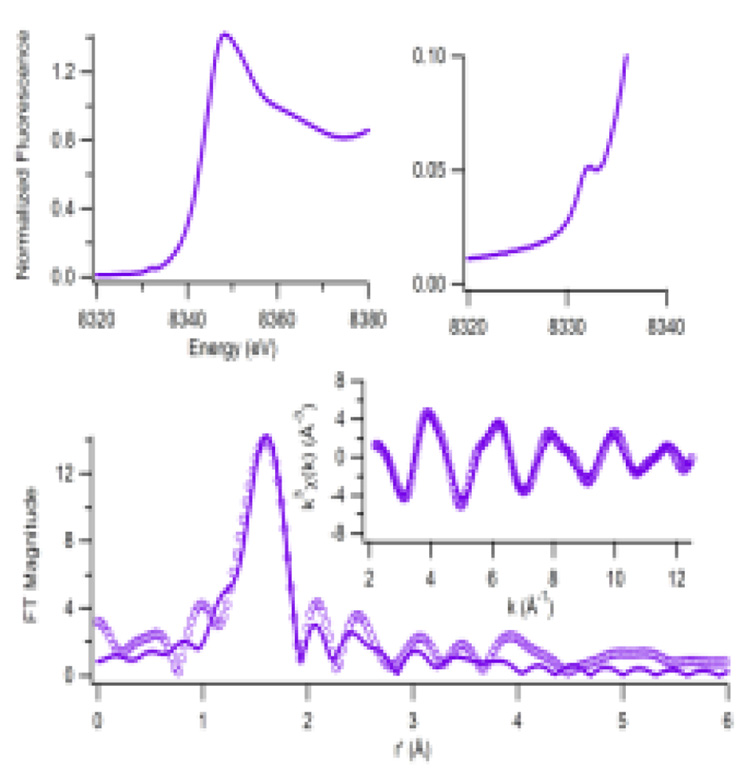
Figure 3.
Ni K-edge XAS of HpHypA. The Ni XANES spectrum (top left) shows a small peak associated with a 1s→3d transition (top right). Bottom: The Fourier-transformed EXAFS spectra (circles (FT window = 2–12.5 Å−1, uncorrected for phase shifts,) and selected fits (solid line) calculated for the Ni center (3N/O @ 2.04(1) Å (σ2 = 0.003(1) Å2) + 3N/O @ 2.15(3) Å (σ2 = 0.010(6) Å2) with one of the N/O @ 2.04 Å being fit as an imidazole using multiple scattering parameters, GOF = 0.59) and for the Cu site (4N/O @ 1.97(1) Å (σ2 = 0.005(1) Å2) with one of the being fit as an imidazole, GOF = 0.44 (See supporting information).

