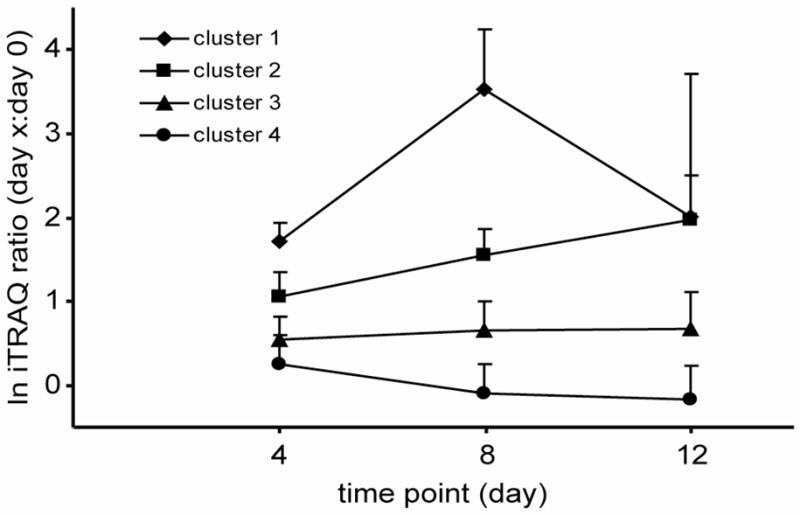
Figure 3.

K-means cluster analysis of 72 proteins that were found in two separate sets of samples and identified with both ProQuant and Spectrum Mill. Proteins were clustered using the expression levels at the three time points as variables. K was set to 4. Means of the natural logged ratios for each cluster group and time point are shown with error bars representing the standard deviation.
