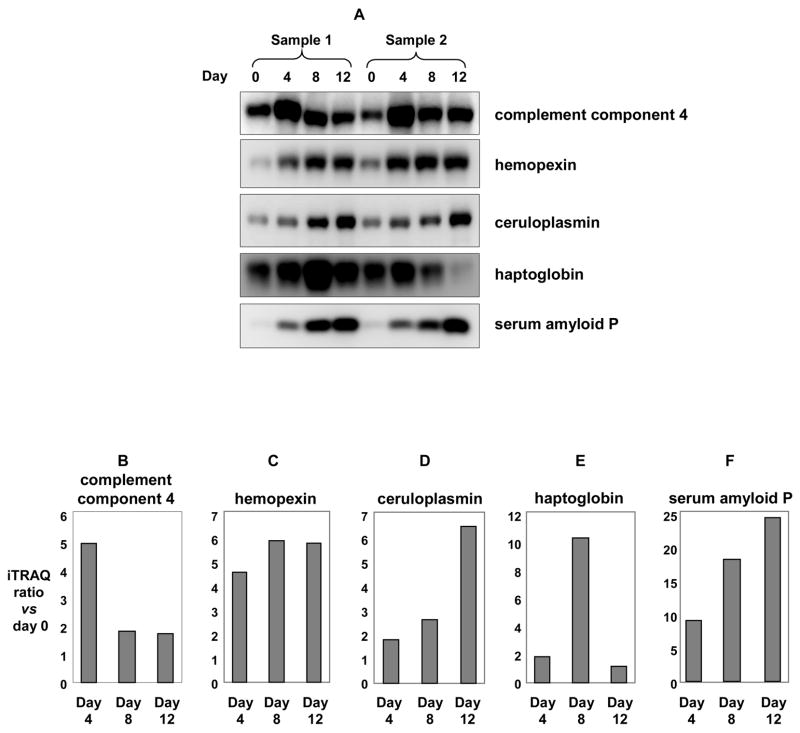
Figure 4.
Quantitative immunoblot analysis for five representative proteins identified by iTRAQ analysis: complement component 4 (B), hemopexin (C), ceruloplasmin (D), serum amyloid P (E), and haptoglobin (F) in mouse plasma during tumor growth in SJL mice. Figure 4A: Plasma proteins (5μg) from two sets of SJL mice were collected at 0, 4, 8, and 12 days after RcsX-tumor cell injection, separated by SDSPAGE, then transferred to PVDF membranes and probed with the indicated antibodies. Figure 4B-F: Relative ratios with respect to day 0 for complement component 4 (B), hemopexin (C), ceruloplasmin (D), haptoglobin (E), and serum amyloid P (F) using ProQuant.

