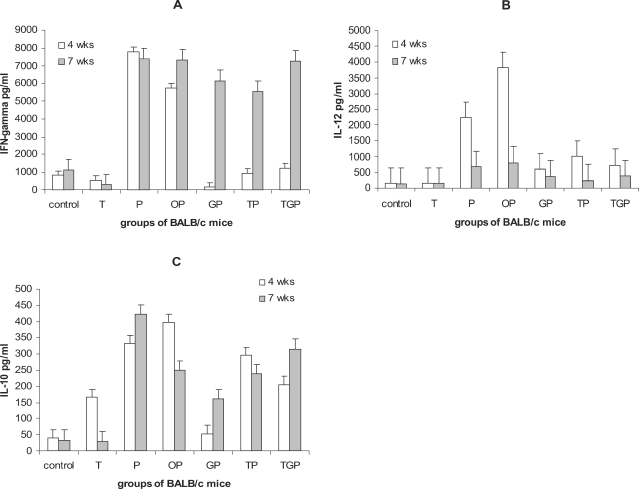
Fig. 2.
Cytokine production in different groups of mice: cytokine production by draining lymph node cells of mice stimulated with PMA/I at the end of therapy (4 weeks after challenge) and three weeks later (7 weeks after challenge) were measured. Figures A-C shows the production of IFN-γ, IL-12 and IL-10, respectively. The groups included control mice; not-infected and non-treated, Group T; non-infected but treated with thalidomide, Group P; infected but non-treated, Goup OP; infected treated with sessami oil (carrier of thalidomide), Group TP; infected treated with thalidomide in sessami oil, Group GP; infected treated with glucantime, Group TGP; infected treated with thalidomide and glucantime.

