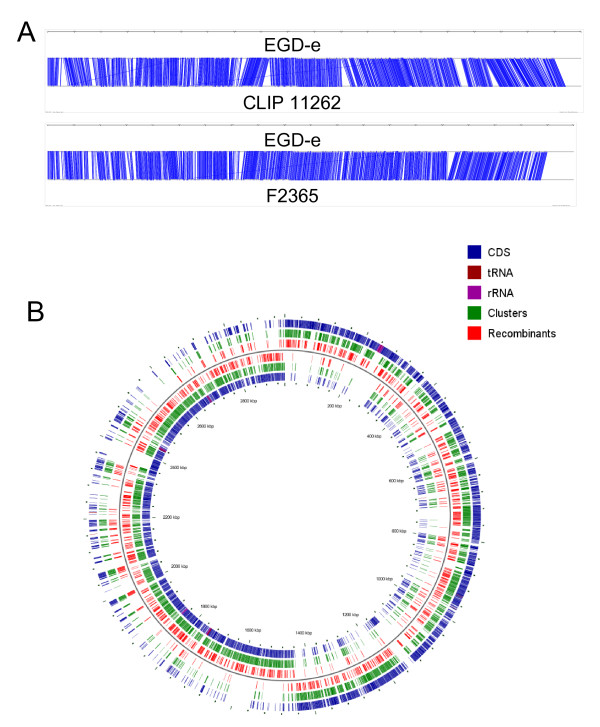
Figure 2.
Schematic representations of the genes analyzed including (A) relative position of the orthologs in EGD-e, CLIP 11262 and F2365; and (B) circular chromosome of EGD-e. In "B" all protein coding, tRNA, and rRNA genes are shown in blue, brown, and purple; all genes analyzed are shown in green and genes with evidence for recombination (at least one test significant) are shown in red. There was no evidence for spatial clustering of genes with evidence for recombination (P = 0.957; U-test).

