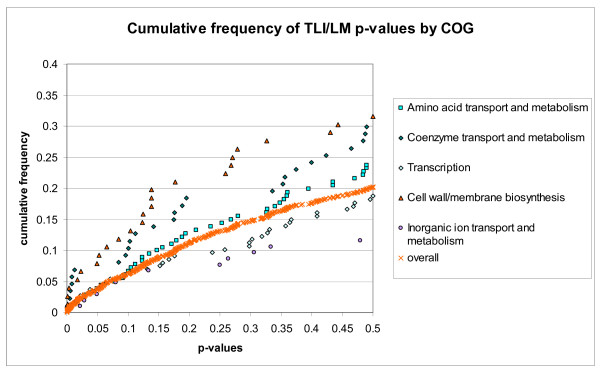
Figure 3.
Cumulative distribution of the p-values obtained from TLI/LM for selected COGs. "Overall" represents all p-values regardless of the COG classification. Genes involved in "Cell-wall/membrane biosynthesis", "Coenzyme transport and metabolism", and "Amino acid transport and metabolism" showed a tendency to have lower p-values in comparison with all genes analyzed, while genes involved in "Transcription" and "Inorganic ion transport and metabolism" showed a tendency to have higher p-values than all genes analyzed.

