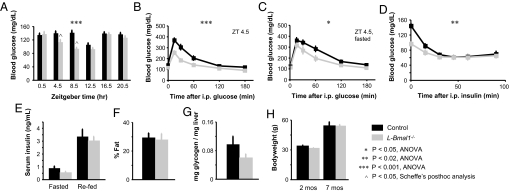
Fig. 4.
Hypoglycemia restricted to the fasting phase and exaggerated glucose clearance in mice with a liver-specific loss of circadian clock function. (A) Resting blood glucose of mice with the indicated genotypes measured across a 24-h cycle. The left half of the profile corresponds to the fasting phase of the daily behavioral cycle. The difference between genotypes over time is accounted for by the differences at fasting phase time-points ZT 4.5 and ZT 8.5. (B) Glucose tolerance; ZT 4.5. (C) Glucose tolerance after overnight fasting; ZT 4.5. (D) Insulin tolerance. The curves converge, with the significant difference between genotypes arising from the lower initial blood glucose in L-Bmal1−/− mice; ZT 8.5. (E) Serum insulin concentrations after mice were fasted overnight or fasted overnight and refed, as labeled. (F) Total body fat content. (G) Liver glycogen content. (H) Bodyweight at the indicated ages. For E–H, there were no significant differences between genotypes. Shown are the mean and SEM for 7–9 mice of each genotype. *, P < 0.05, ANOVA; **, P < 0.02, ANOVA; ***, P < 0.001, ANOVA; ∧, P < 0.05, Scheffé's post hoc analysis.

