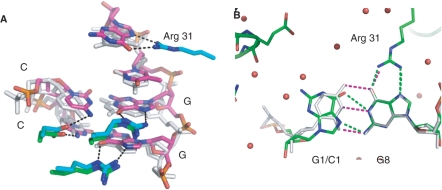
Figure 5.
Comparisons of DNA and metal ion binding. (A) Superposition of one-half site of the recognition sequences of SgrAI (pink, blue and red) and NgoMIV (white) and side chains of contacting residues (SgrAI in cyan, blue, red, NgoMIV in green, blue, red). (B) Superposition of SgrAI bound to cognate DNA (Form 2, white) on SgrAI bound to DNA containing a G–G mismatch at the outer base pairs of the SgrAI recognition sequence (Form 1, color) at the site of the mismatch. The G is contacted by Arg 31, however, no contacts are made to the base pairing partner. The non-contacted G (G1) adopts the syn conformation at the glyosidic bond. Hydrogen bonds are shown as purple dashes (Form 2 with cognate DNA) and green dashes (Form 1, mismatched non-cognate DNA).

