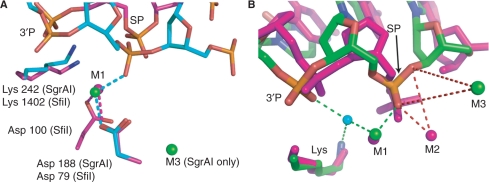
Figure 8.
Comparison of SgrAI active site with SfiI and NgoMIV. (A) Superposition of active sites of SgrAI (cyan, blue, red, orange, green) and SfiI (magenta, blue, red, orange). Metal ions shown as spheres. (B) Superposition using the alpha carbon atoms of Lys 242, Glu 103 and Asp 188 of SgrAI Form 2 with Ca2+ onto Lys 187, Glu 70 and Asp 140 of NgoMIV, respectively. NgoMIV shown in magenta. Pink spheres indicate Mg2+ ions. SgrAI is shown in green, blue, orange and red. Green spheres indicate Ca2+ ions. Blue sphere indicates water molecule positioned for in-line attack. SP, phosphate of the scissile phosphodiester bond, 3′P, phosphate 3′ to the SP. M1 and M2 refer to the two-metal-ion binding sites. Green dashed lines indicate interactions at distances consistent with metal ion–ligand interactions or hydrogen bonds. Red dashes indicate distances too long for metal ion–ligand interactions to occur. Interactions predicted to occur in the two-metal-ion mechanism to the SP and O3′ of the SgrAI DNA by a metal ion at either M2 site are too distant to occur.

