Figure 5.
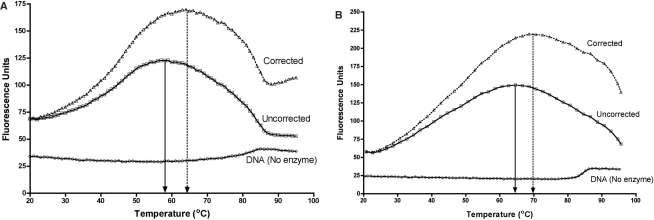
Temperature profiles of base flipping. (A) Profile of 2AP26 fluorescence in the absence and presence of M.PspGI. The DNA was in MTase buffer at 500 nM and the enzyme was at 3-fold molar excess. The fluorescence intensities are shown with empty squares. The intensity values were corrected for relative decrease in fluorescence of 2APTP (Supplementary Figure S6). The corrected data are plotted as open triangles. Positions of peaks in each plot are indicated by a vertical arrow. The fluorescence profile of 2AP26 duplex without protein as a function of temperature is shown as circles. (B) Profile of 2AP27 fluorescence in the absence and presence of R.PspGI D138A mutant. The DNA was in REase buffer supplemented with CaCl2 (10 mM) at 500 nM and the enzyme was at 3-fold molar excess. The fluorescence intensities are shown with empty squares. The intensity values were corrected for relative decrease in fluorescence of 2APTP (Supplementary Figure S6). The corrected data are plotted as open triangles. Positions of peaks in each plot are indicated by a vertical arrow. The fluorescence profile of 2AP27 duplex without protein as a function of temperature is shown as circles.

