Figure 1.
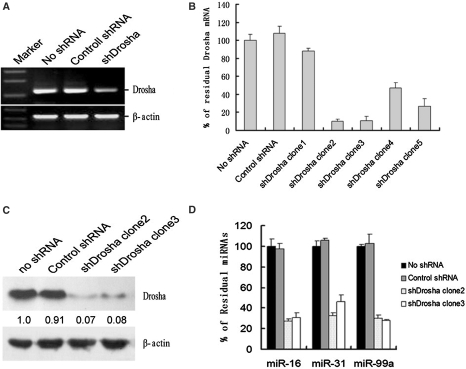
Generation and characterization of Drosha knockdown stable cell lines. (A) The effectiveness of Drosha depletion was analyzed by semi-quantitative RT–PCR. Normal HeLa cells and control shRNA transfected HeLa cells are in lanes 1 and 2. The β-actin mRNA served as an internal control. (B) The depletion effectiveness in Drosha knockdown stable HepG2 cell lines was analyzed by qRT–PCR. Drosha mRNA was reduced in all selected stable cell clones, five of which were shown respectively in bars 3–7 (bar 1: normal HepG2 cells; bar 2: control stably transfected HepG2 cells). shDrosha clone 2 in bar 4 demonstrated a strong downregulation to 95% of Drosha mRNA. (C) Drosha protein was detected by western blot. (D) miRNA expressions were detected by qRT–PCR. The expression levels of three miRNAs selected randomly, including miR-16, miR-31 and miR-99a decreased moderately in shDrosha clone 2 and clone 3 compared with normal HepG2 cells and control stably transfected HepG2 cells.

