Figure 2.
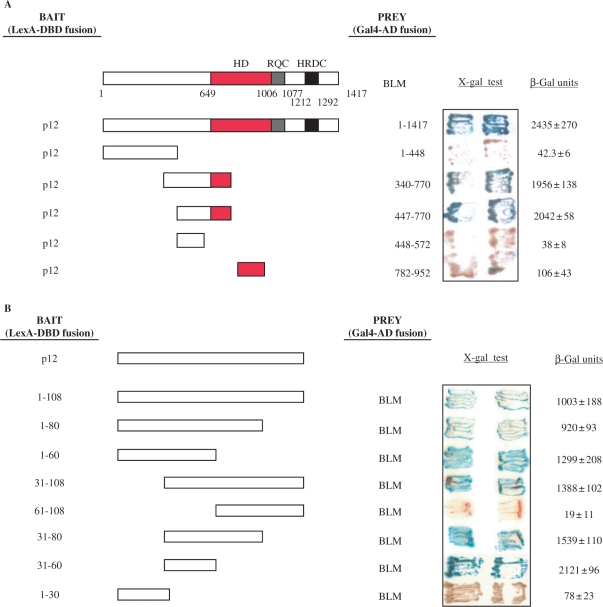
Interaction region mapping of BLM and p12. (A) Mapping of the BLM interaction region. The L40 yeast strain was co-transformed with plasmids encoding the indicated BLM fragments fused to Gal4-AD and the full-length p12 fused to LexA-DBD. Two independent colonies were grown on SD agar plates lacking tryptophan and leucine, but containing X-gal, prior to assessment of β-galactosidase activity. Blue coloration of colonies is a marker of interaction. Full length BLM is also shown, with a red bar indicating its conserved helicase domain, a blue bar indicating RQC and a black bar indicating the HRDC domain. Interactions between a given bait/prey pair were quantified by measurements of β-galactosidase activity. Values represent means ± SD of three independent experiments. (B) Mapping of the p12 interaction region. The L40 yeast strain was co-transformed with plasmids encoding the indicated p12 fragments fused to LexA-DBD and full length BLM fused to Gal4-AD. In both (A) and (B) the sequence boundaries of deletion mutants tested are shown with the corresponding amino acid positions indicated on the right. Values obtained from liquid β-galactosidase assay are shown on the right and represent means ± SD of three independent experiments.

