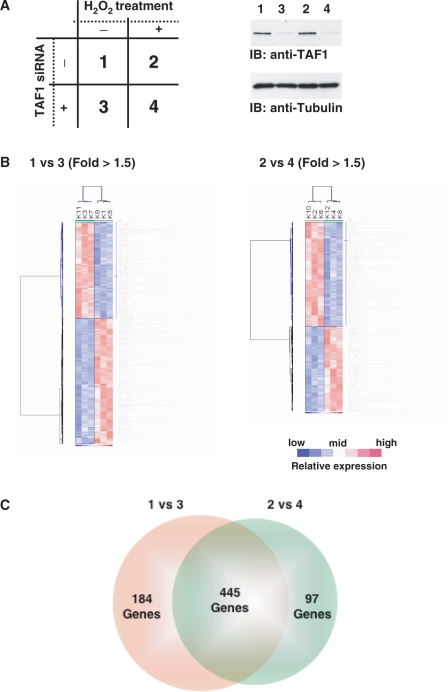
Figure 3.
GeneChip analysis for responsive gene modulated by transcription factor TAF1. (A) Experimental conditions of the GeneChip analysis. 1: Cells transfected with scramble siRNA; 2: cells transfected with scramble siRNA and treated with H2O2; 3: cells transfected with TAF1 siRNA; 4: cells transfected with TAF1 siRNA and treated with H2O2. Cell lysates were subjected to immunoblot analysis with indicated antibodies. (B) Hierarchical clustering depicting expression profiles of differentially regulated genes by depletion of TAF1 gene. The data indicate the means from three independent experiments, each performed in triplicate. 1 versus 3, the value for the expression level of condition 1 divided by that of condition 3; 2 versus 4, the value for the expression level of condition 2 divided by that of condition 4. Up- and down-regulated genes are depicted in red and blue, respectively. (C) The number of GeneChip probes more than 1.5-fold up- or down-regulated by knocking down TAF1 is indicated.

