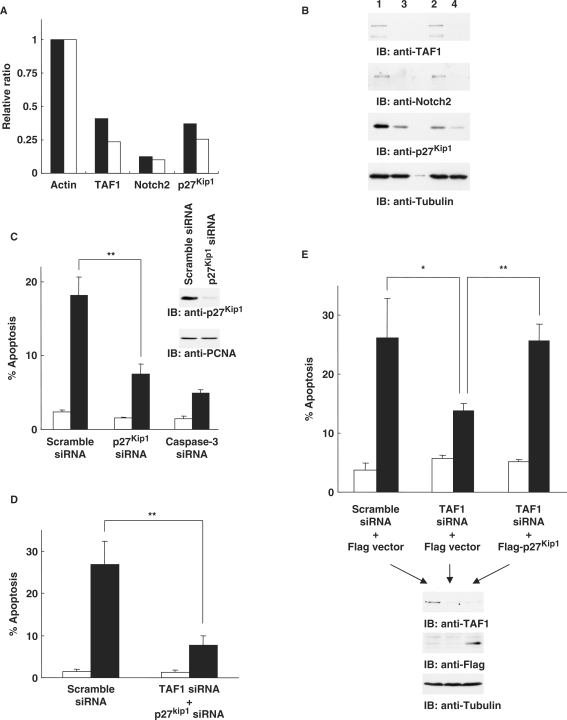
Figure 4.
TAF1 controls oxidative stress-induced apoptosis by regulating p27Kip1 expression. (A) Quantitation of TAF1, Notch2 and p27Kip1 mRNAs by real-time RT–PCR analysis. Closed bars represent the value for the expression level of condition 3 (Figure 3A) divided by that of condition 1; open bars represent the value for the expression level of condition 4 divided by that of condition 2. The value is normalized by the expression level of actin. (B) 293T cells transfected with scramble siRNA or the TAF1 siRNA were left untreated or treated with H2O2 for 24 h. Cell lysates were subjected to immunoblot analysis with anti-TAF1, anti-Notch2, anti-p27Kip1 or antitubulin. (C) p27Kip1 gene-specific siRNA attenuates induction of apoptosis in response to DNA damage. 293T cells transfected with scramble, p27Kip1, or caspase-3 siRNA were left untreated (open bar) or treated (closed bar) with H2O2 for 24 h. The percentage of apoptotic cells was determined by TUNEL assays. The data indicate the means ± SD from three independent experiments, each performed in triplicate. Two asterisks indicate P < 0.01. Cell lysates were subjected to immunoblot analysis with anti-p27Kip1 or anti-PCNA. (D) 293T cells were transfected with scramble siRNA or the TAF1 and p27Kip1 siRNAs together, then left untreated or treated with H2O2 for 24 h. Apoptotic cells were analyzed as described above. (E) 293T cells pretransfected with TAF1 siRNA were transfected with Flag vector or Flag-p27Kip1, then left untreated or treated with H2O2 for 24 h. The percentage of apoptotic cells was determined by TUNEL assays. The data indicate the means ± SD from three independent experiments, each performed in triplicate. One asterisk and two asterisks indicate P < 0.05 and P < 0.01, respectively. Cell lysates were subjected to immunoblot analysis with anti-TAF1, anti-Flag or antitubulin.

