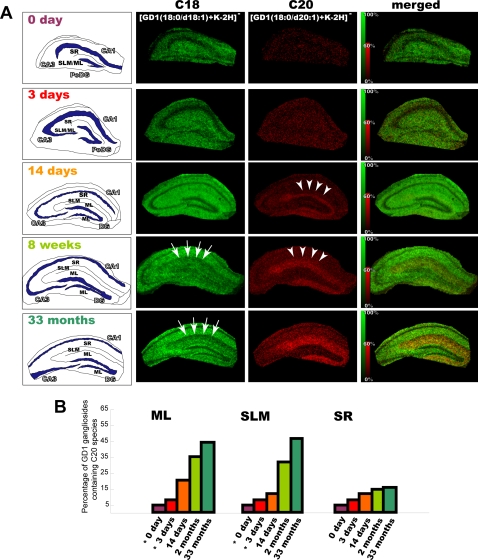
Figure 5. Development- and aging-related accumulation of C20-GD1 in the ML and SLM of the hippocampal formation.
We visualized the ion corresponding to GD1 (m/z 1874 and 1902) in the mouse hippocampus at the indicated time points (P0, P3, P14, 1 month, and 33 months). For each time point, intensity scale of C20-GD1 is normalized in order that the brightest pixels of C20-GD1 have 60% of the maximal C18-GD1 intensity value. In the P14 mouse hippocampus, C20-GD1 was concentrated in the narrow area of DG-SMm and began to spread over the medial edge of the region (arrow heads). In contrast, the concentration of the C-18 species decreased in the ML/SLM with aging (arrows). Quantification result of C20-GD1 on the total GD1 signal in the ML, SLM and SR region has also been shown (B). *; At P0 and P3, we could not distinguish between the ML and SLM area; therefore, values obtained from the region corresponding to ML/SLM have been used for both the regions in the graph.

