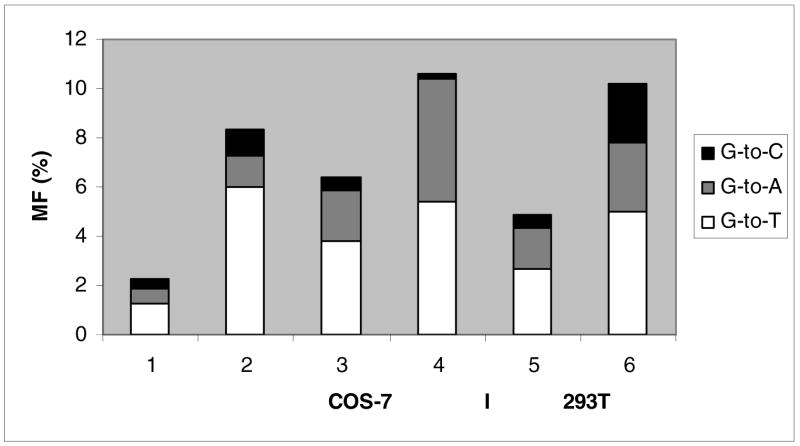
Figure 3.
Sequence context effects of C8-AP-dG mutagenesis in mammalian cells. 1–4 represent targeted mutations in COS-7 cells, whereas 5 & 6 are results from 293T cells. 1 = CCATCGAPCTACC, 2 = CGCGAPCG, 3 & 5 = GTGCGAPTGTTTGT, and 4 & 6 = GTGC5-MeGAPTGTTTGT; in the bar graph, targeted G→T, G→A, and G→C mutations are represented by white, gray, and black, respectively.

