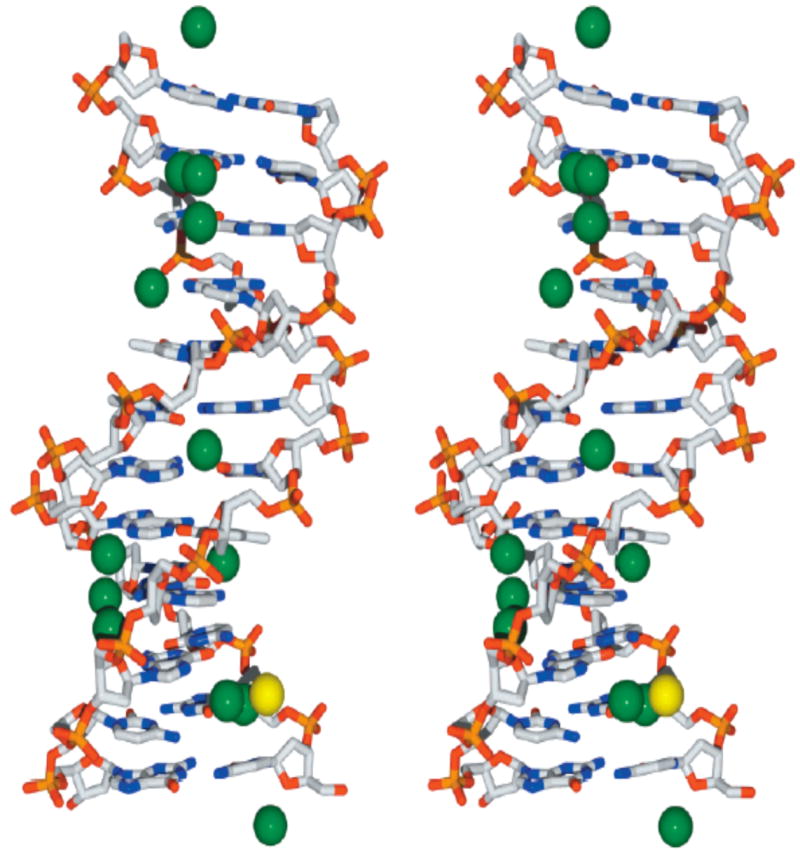
Figure 7.

Relaxed stereoview of 5′-d(CGCGAATTCGCG)2 (DDD) and associated Tl+ ions based upon 1.2 Å resolution x-ray data(65). Tl+ ions are depicted by green spheres; the sole Mg2+ ion is depicted by a yellow sphere. The DNA is shown in stick representation with standard CPK color coding of atoms. H2O molecules have been omitted for clarity. For reference the minor groove is in the vertical center of the DNA molecule.
