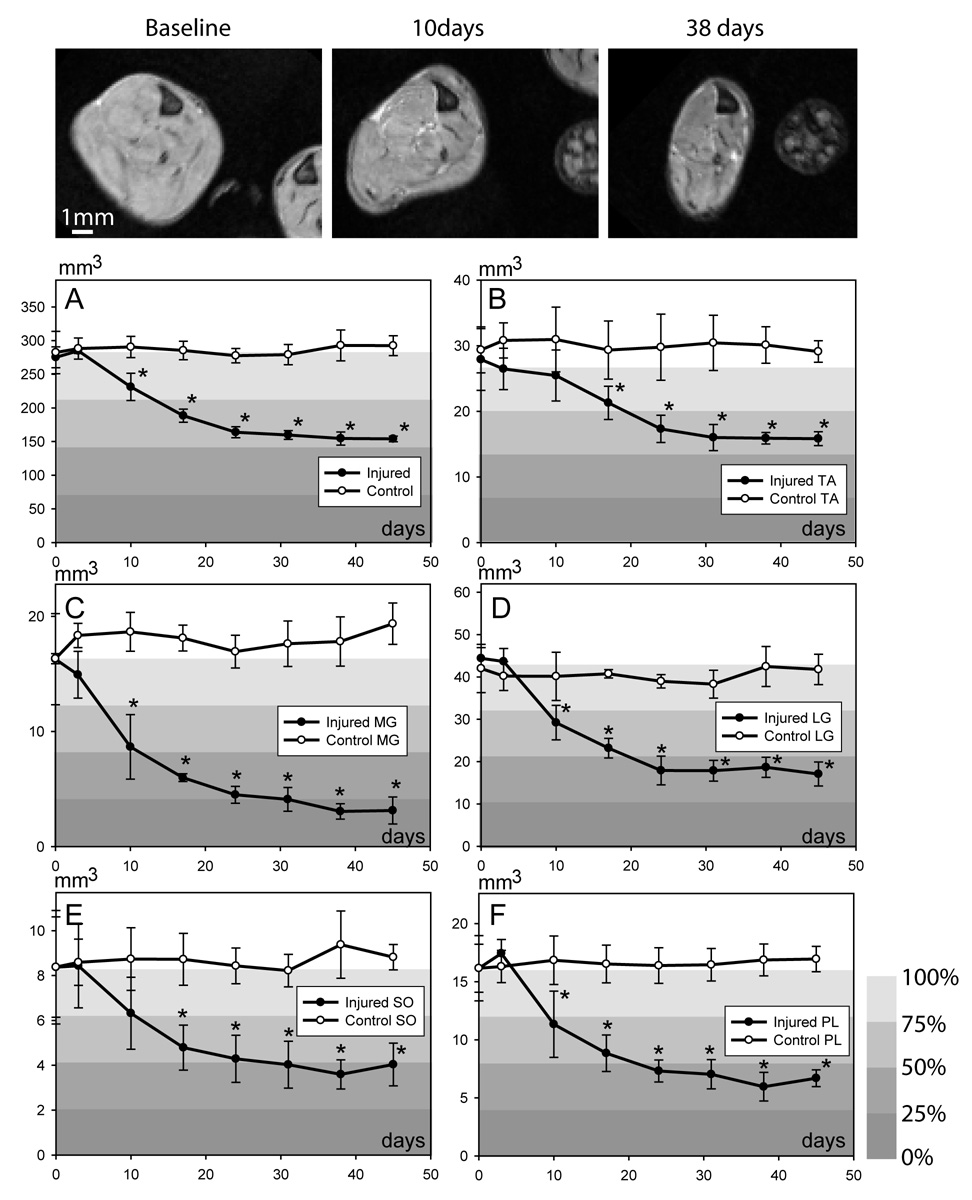
Figure 3.
Temporal changes in the calf muscle volumes before and after complete denervation shown in axial images (top panel). A–F: Quantitative data showing temporal profile of muscle atrophy in entire calf (A), tibialis anterior (TA; B), medial gastrocnemius (MG; C), lateral gastrocnemius (LG; D), soleus (SO; E) and plantaris (PL; F) muscles. Relative muscle volume, measured as percentage of their baseline values, is represented by color-coded background. * p < 0.05; Student’s t-test.

