
Figure 4.
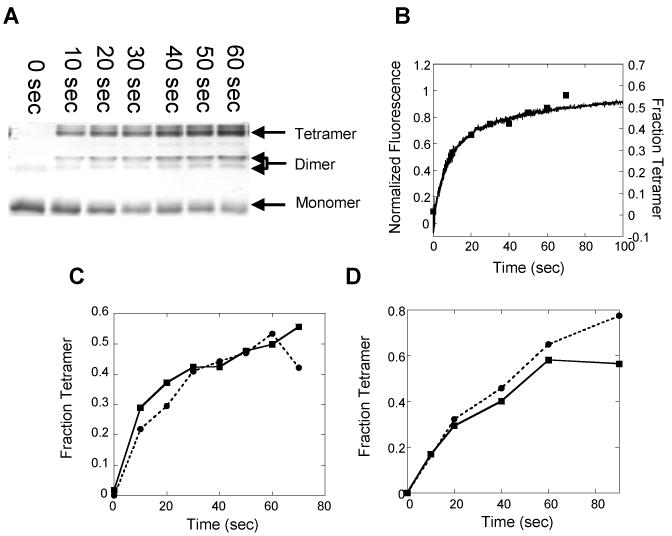
Glutaraldehyde crosslinking analysis of TTR homotetramer reassembly. A) SDS-PAGE assessment of glutaraldehyde crosslinked oligomers that exist at various time points in TTR reassembly reactions. The reassembly reaction was allowed to proceed for the indicated time prior to crosslinking of the sample. The arrows indicate the different oligomeric species observed by SDS-PAGE analysis. B) Overlay of TTR reassembly (4.32 µM; monomer) as measured by the fluorescence of 1 (black line) and glutaraldehyde crosslinking (black squares). The two time courses are nearly identical indicating that both assays are measuring the same process. C) Glutaraldehyde crosslinking analysis of TTR reassembly (4.32 µM; monomer) in the presence (circles and dashed line) or absence (squares and solid line) of small molecule 1. The nearly identical time courses demonstrate that the small molecule does not seem to affect the reassembly kinetics. D) Glutaraldehyde crosslinking analysis of TTR reassembly (1.44 µM; monomer) in the presence (circles and dashed line) or absence (squares and solid line) of small molecule 1. The nearly identical kinetics demonstrates that the small molecule does not appear to affect the reassembly kinetics.