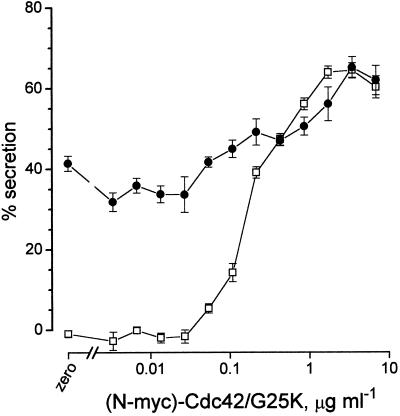
Figure 9.
Concentration–effect relationships for preactivated N-Myc-Cdc42/G25K applied either alone or together with a saturating concentration of preactivated Rac2 (10 μg ml−1) in mast cells stimulated by Ca2+ (pCa5) alone. In this experiment the cells were allowed to run down for 7 min before application of the stimulus. Results are expressed as means ± SEM (n = 4). Open symbols indicate effect of N-Myc-Cdc42/G25K alone; closed symbols indicate effect of Rac2 (10 μg ml−1) and N-Myc-Cdc42/G25K.

