
Figure 2.
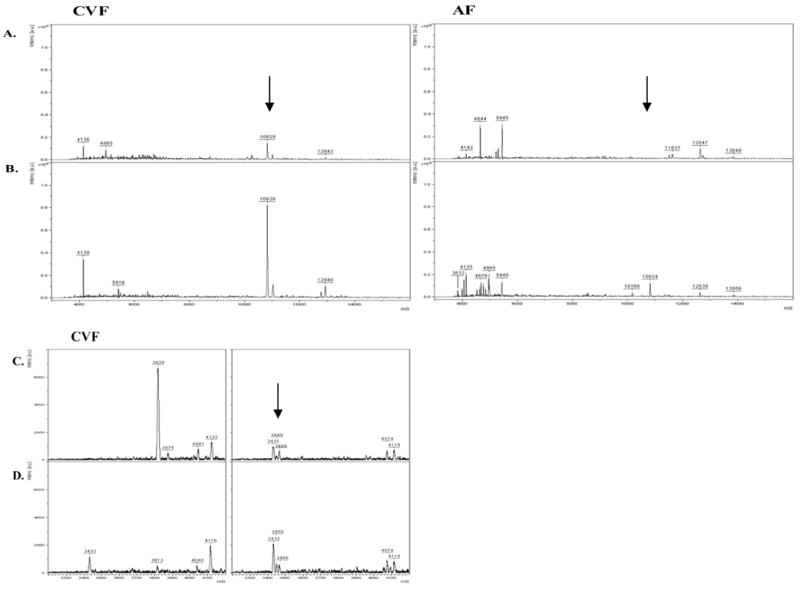
A–D. Matrix-assisted laser desorption/ionization time-of-flight (MALDI-TOF-MS) protein profiles of Ureaplasma parvum-induced differential protein levels in non-human primate CVF and AF samples. Profiles demonstrating the 10.8-kDa peak are shown in control samples taken prior to (A) and following (B) experimental IAI. Profiles demonstrating peptides in the 3–5-kDa MW range are shown in C) control samples taken prior to and D) samples taken following experimental IAI. Spectra were processed for baseline subtraction and Savitsky-Golay smoothing, 5 cycles at 10 Da/channel. Spectra representing m/z range from 3000 to 2000 are shown with arrows indicating differentially expressed peaks between control and infection.