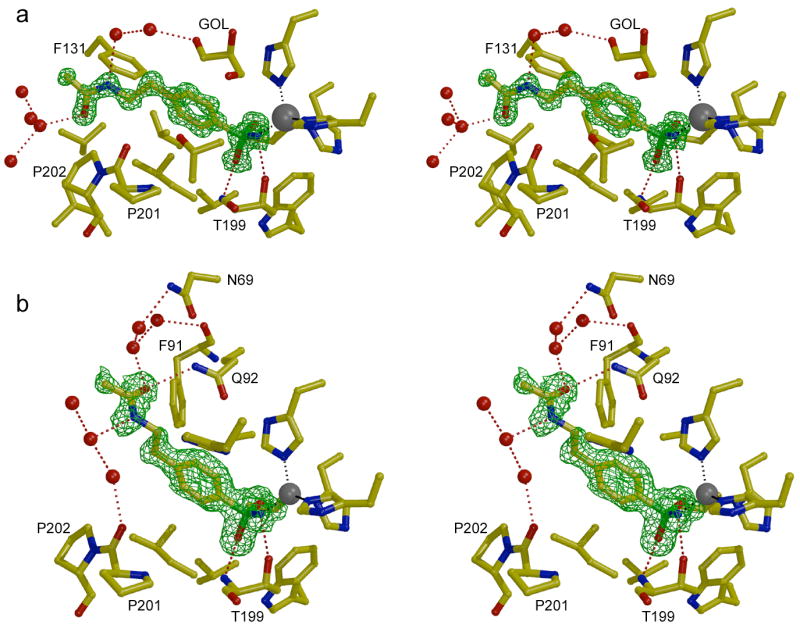
Figure 3.

Omit maps showing the binding of inhibitor MH 1.25 to CA II (a) and CA I (b) contoured at 3σ. The zinc ion appears as a gray sphere and water molecules appear as red spheres. A glycerol cryosolvent molecule (GOL) also binds in the CA II active site. Hydrogen bond and metal coordination interactions are designated by red and gray dotted lines, respectively. Figure prepared with Bobscript and Raster3D.28
