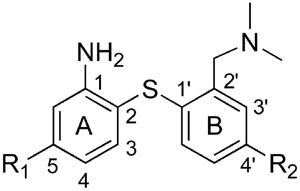
Table 1.
Binding affinities of new biphenylthiols for monoamine transporters*
 | |||||
|---|---|---|---|---|---|
|
Ki (nM)
|
|||||
| Compound | R1 | R2 | SERT | NET | DAT |
| 28 | H | O(CH2)2F | 0.25 ± 0.02 | 7.5 ± 0.7 | 340 ± 64 |
| 29 | F | O(CH2)2F | 0.10 ± 0.01 | 37 ± 5 | >1000 |
| 30 | Cl | O(CH2)2F | 0.03 ± 0.001 | 97 ± 3 | 847 ± 73 |
| 31 | Br | O(CH2)2F | 0.05 ± 0.01 | 114 ± 8 | >1000 |
| 40 | H | O(CH2)3F | 1.4 ± 0.2 | 12 ± 2 | 299 ± 9 |
| 41 | F | O(CH2)3F | 0.95 ± 0.13 | 95 ± 9 | >1000 |
| 42 | Br | O(CH2)3F | 0.15 ± 0.02 | >1000 | >1000 |
| 47 | H | O(CH2)2OH | 1.1 ± 0.04 | 11 ± 1 | 351 ± 49 |
| 48 | F | O(CH2)2OH | 1.2 ± 0.1 | 56 ± 5 | >1000 |
| 49 | H | O(CH2)3OH | 1.3 ± 0.3 | 7 ± 0.2 | 443 ± 68 |
| 50 | Br | O(CH2)3OH | 0.21 ± 0.02 | 279 ± 25 | >1000 |
| 43 | H | OCH3 | 5 ± 0.4 | 14 ± 1 | 576 ± 31 |
| 44 | H | OH | 17 ± 2 | 33 ± 3 | 659 ± 38 |
In vitro binding assays (n = 3) were employed to determine inhibition constants (Ki ± SEM) with membrane preparations of three different groups of LLC-PK1 cells, each expressing one specific monoamine transporter, either SERT, DAT or NET.47
