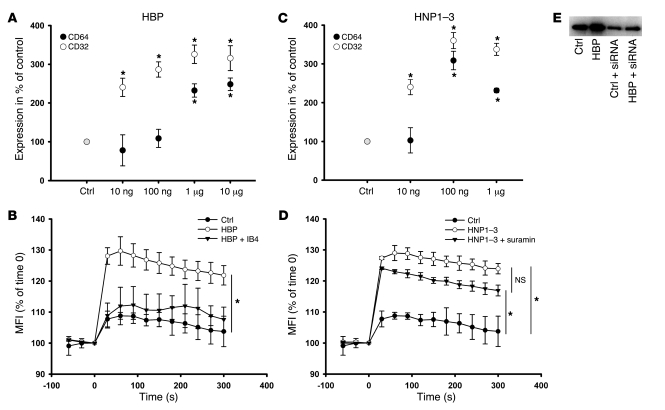
Figure 6. Characterization of the enhanced phagocytosis by HBP and HNP1–3.
(A and C) Human macrophages were treated with increasing concentrations of (A) HBP or (C) HNP1–3 for 24 hours, and the expression of CD32 and CD64 was assessed by immunofluorescence. Data are expressed as a percentage of basal expression, which was set to 100%. For each analysis, 5 independent experiments were performed. *P < 0.05 versus control. (B and D) Intracellular Ca2+-mobilization in macrophages labeled with the Ca2+-sensitive dye fluo4/AM in response to stimulation with (B) HBP (1 μg/ml) and (D) HNP1–3 (1 μg/ml). After labeling and washing, fluorescence was read in a plate reader every 30 seconds, from 60 seconds before stimulation until 300 seconds after stimulation. Data are expressed as percent of fluorescence intensity at time 0. IB4 (10 μg/ml) or suramin (100 μM) were added to analyze the involvement of β2 integrins and P2Y6 receptors in the respective activation. For each analysis, 4 independent experiments were performed. *P < 0.05 versus control treatment. (E) Western blot for CD64 of whole cell lysate of human macrophages treated with HBP (1 μg/ml, 24 hours) in the presence or absence of siRNA to CD64.

