
Figure 6. Adenoviral gene transfer of GFP and CRNK in normal hearts.
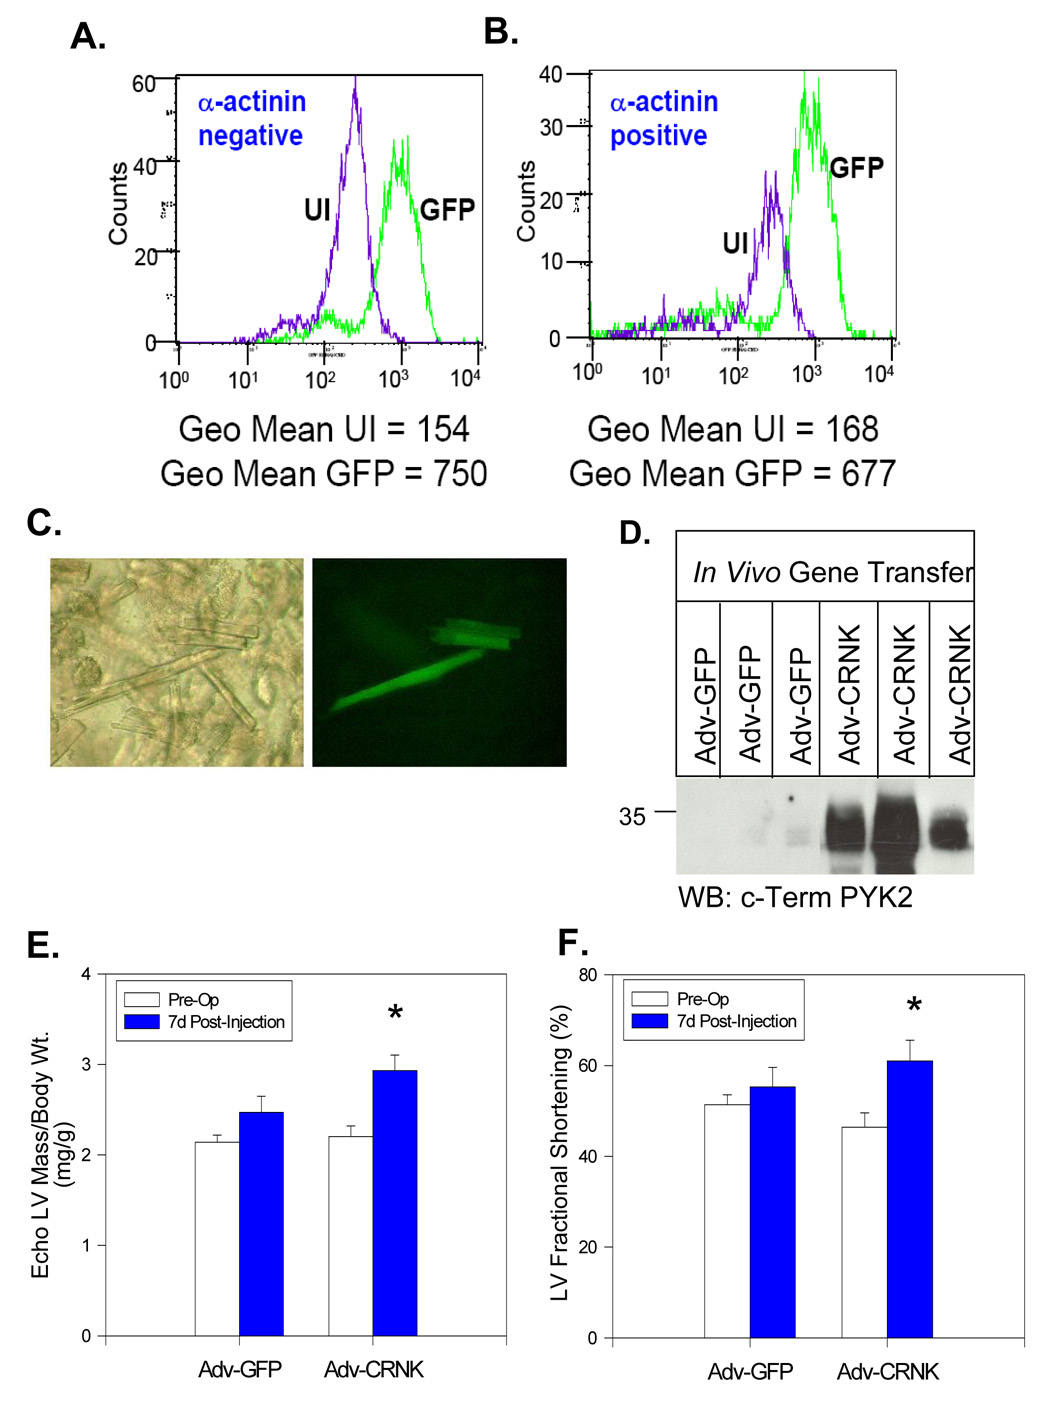
Peak fluorescence of GFP in the myocyte and non-myocyte cell populations was assessed by flow cytometry. in ventricular cells isolated from an uninfected heart, and a GFP-expressing heart 5 days following adenoviral gene transfer. Myocytes (α-actinin postitive cells) showed a large shift in peak GFP fluorescence in the cells isolated from the Adv-GFP infected heart as compared to the cells from the uninfected heart (Panel B). Interestingly, in the non-myocyte population (α-actinin negative), there was also a significant increase in the peak fluorescence in cells isolated from the GFP heart (Panel A). In Panel C, freshly isolated cells were examined by phase contrast microscopy (left) and by epifluorescent microscopy (right). In Panel D, ventricular tissue homogenates derived from the LV apex of 3 rats infected with Adv-GFP and 3 rats infected with Adv-CRNK were compared by SDS-PAGE and Western blotting 1 wk after gene transfer. In Panels E and F, pre-operative and 7-d post-operative echo-derived LV/body weight ratios and LV fractional shortening were compared in animals infected with Adv-GFP (n=16) and animals infected with Adv-CRNK (n=12). *P<0.05 for pre-vs. post-operative measurements for each treatment group.