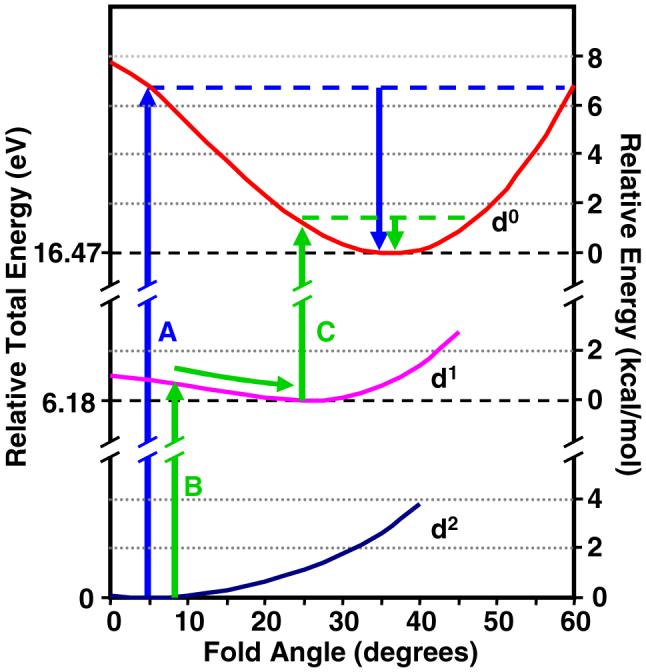
Figure 7.

The gas-phase potential energy curve plots of the neutral (d0), cation (d1) and dication (d2) of Cp2Mo(bdt) are shown with relative total energies (eV, left-hand side) and relative potential energies with change in fold angle (kcal/mol, right-hand side). The oxidation along Path A (blue arrows and line) from the d2 to d0 electron configurations involves a large energy barrier to oxidation and larger reorganization energies with change in fold angle. Paths B and C (green arrows and lines) show the two-step two-electron oxidation of the d2 to d1 to d0 electron configurations. Utilization of the shallow d1 potential curve poises oxidation to occur with minimal reorganization energies with change in fold angle.
