
Figure 3.
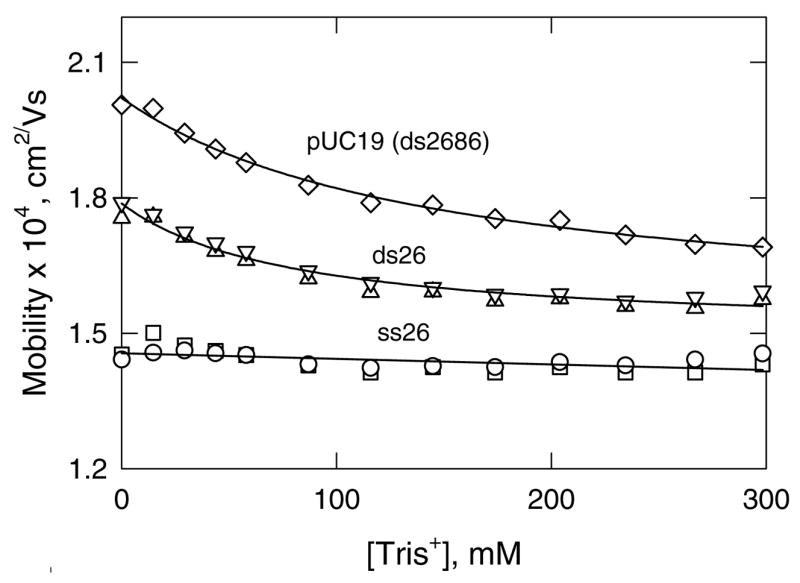
Mobility profiles observed for: (◇) linear pUC19 (ds2686); (△, ▽), ds26; and (○, □), ss26, using Tris+ as the binding ion and TPA+ as the non-binding ion. The two symbols for ds26 and ss26 represent independent runs on different days and illustrate the reproducibility of the method. The lines are drawn to guide the eye.