
Figure 4.
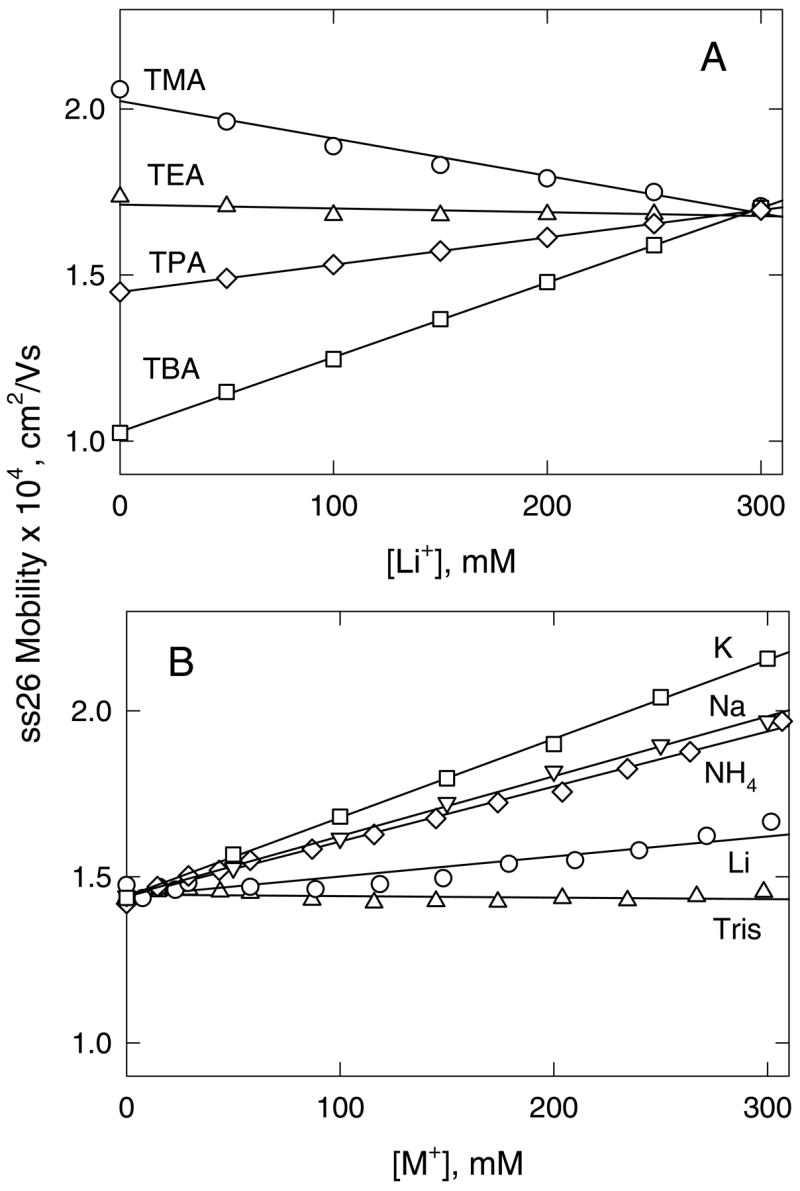
Dependence of the mobility of ss26, plotted as a function of binding ion concentration in solutions containing different replacement ion pairs. (A), Li+ replacing the tetraalkylammonium ions: (○), TMA+; (△), TEA+; (◇), TPA+; and (□), TBA+. (B), TPA+ replaced by: (o), Li+; (▽), Na+; (□), K+; (◇), NH4+; and (△), Tris+. The total cation concentration was always 300 mM. The straight lines were drawn by linear regression, with correlation coefficients, R2 = 0.99.