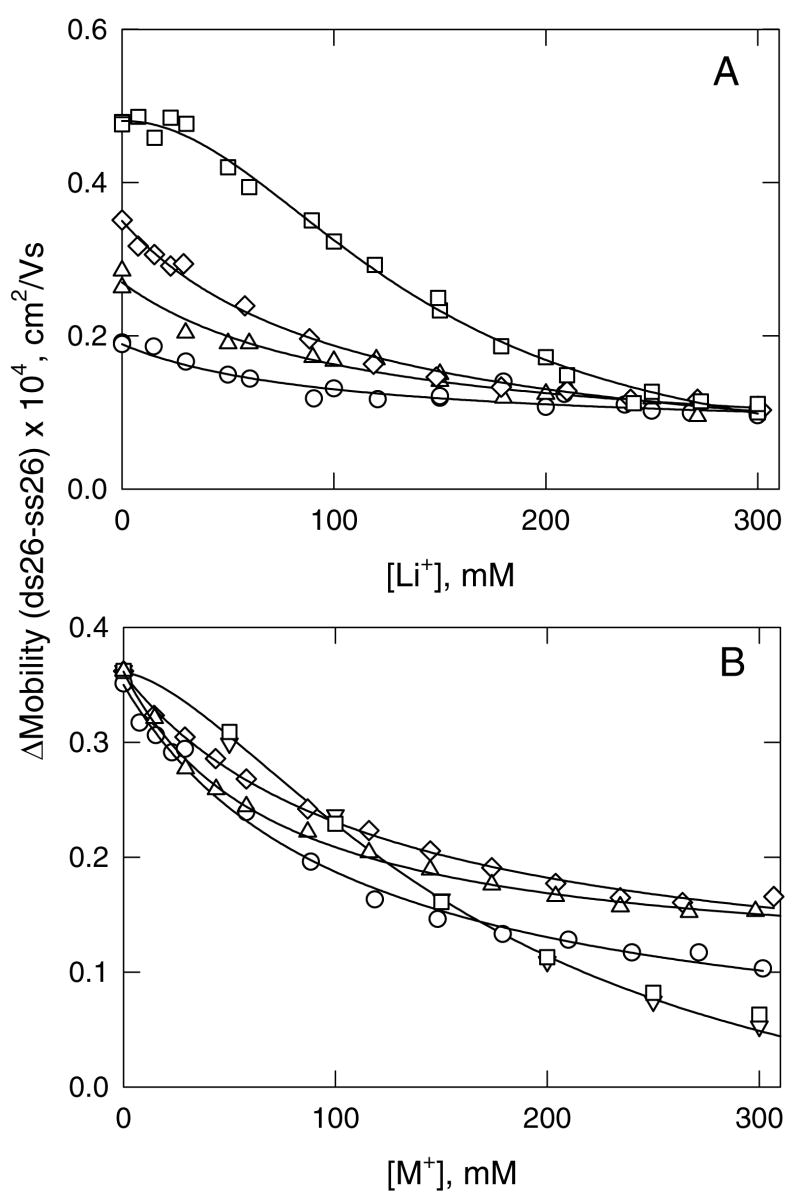
Figure 6.
Difference mobility profiles calculated for ds26. (A), With Li+ as the binding ion and: (o), TMA+; (△), TEA+; (◇), TPA+; and (□), TBA+ as the non-binding ions. (B), With TPA+ as the non-binding ion and: (△), Tris+; (o), Li+; (▽), Na+; (◇), NH4+; and (□), K+ as the binding ions. The curved lines in (A) and (B) were calculated from Eq. (4) or (5), as described in the text, using the apparent KD and cooperativity parameters given in Table 2.

