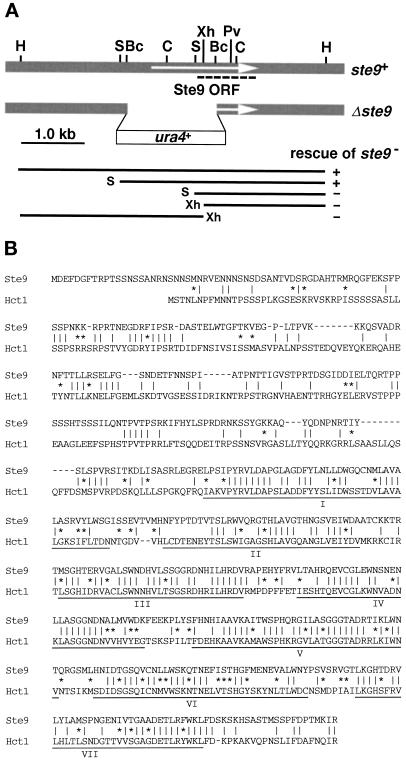
Figure 1.
Molecular cloning and characterization of ste9+. (A) Restriction enzyme map of ste9+. The top shaded box indicates the genomic region around ste9+. The arrow indicates the Ste9 open reading frame. Each WD-repeat is indicated by the black box. Restriction sites: H, HindIII; S, SalI; Bc, BclI; C, ClaI; Xh, XhoI; Pv, PvuII. The second line shows the disrupted ste9 allele. The thin lines in the lower part indicate various truncated genomic fragments. Their ability to rescue the ste9 mutation is indicated by (+) and (−). The nucleotide sequence of ste9+ has been submitted to the DDBJ/EMBL/GenBank databases under accession number AB001285. (B) Alignments of Ste9 and Hct1/Cdh1. Identical amino acids between two proteins are indicated by vertical lines (‖). Residues of similar property are indicated by asterisks (*).

