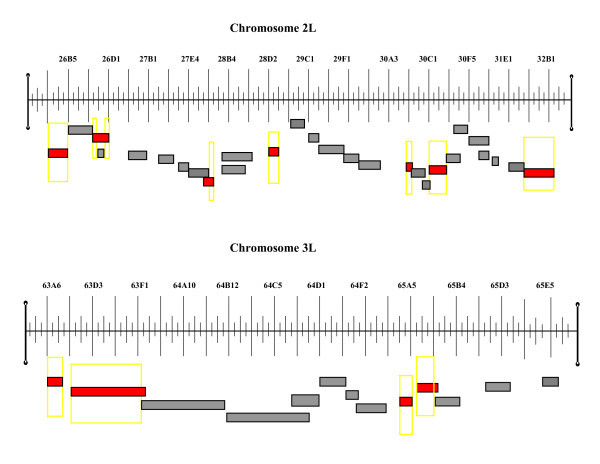
Figure 1.
Quantitative deficiency mapping of D. melanogaster TAG QTL. Long ticks mark sections and short ticks mark subsections of physical maps in the cytological interval 25F5;32B3 on the left (L) arm of chromosome 2 and in the cytological interval 63A6;65E8 on the left arm of chromosome 3. Gray bars represent non-significant deficiencies and red bars correspond to deficiencies with significant failure to complement ORE and 2b QTL for TAG storage. Yellow frames indicate regions where a QTL affecting TAG content between ORE and 2b maps.

