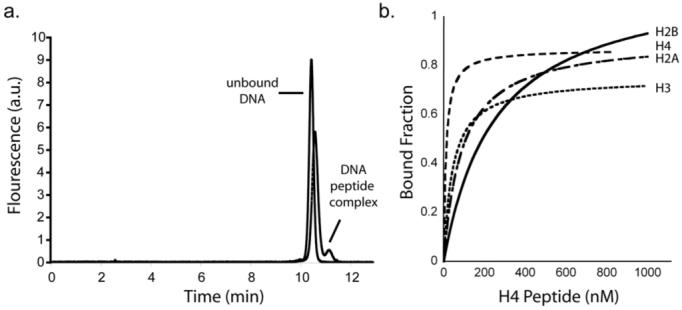
Figure 1.

Aptamer enrichment and specificity to different histone classes. (a) Representative chromatograms from rounds 1 and 4 of the selection. The bound fraction is too small to be seen as a distinct peak in round 1, but is clearly visible after round 4. (b) Binding curves were obtained for aptamer 4.15 with the H4, H3, H2A and H2B peptide tail sequences.
