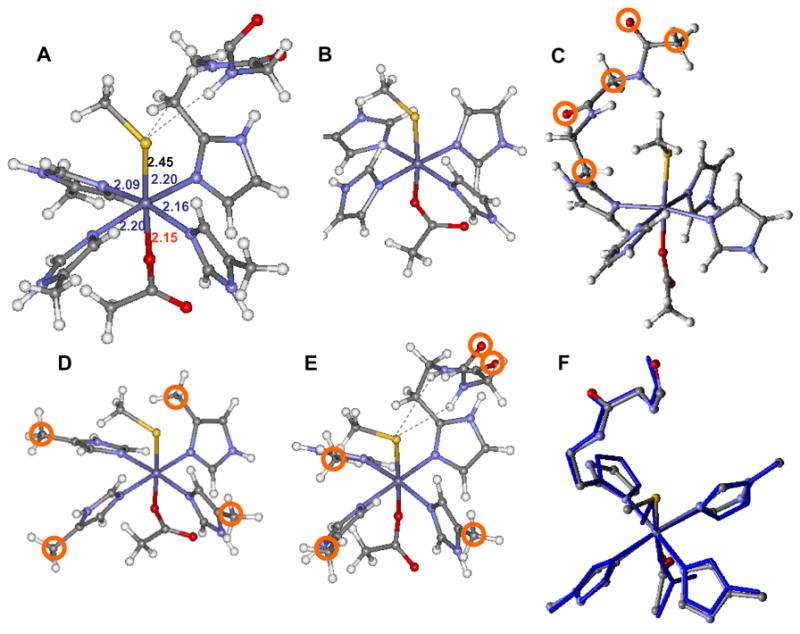
Figure 3.

The crystal structure of the active site of resting oxidized SOR (A), the unconstrained model (B), H-bonded only model (C)60, α carbon constrained model (D), H-bonded and α-carbon constrained model (E) and overlay between the optimized model E (in blue) and X-tal structure (atom colored) from 1DQI (F). The constrained atoms are circled in the respective structures. Bond lengths of the protein crystal structure are given in Å and are color coded as Fe-S, Fe-N and Fe-O.
