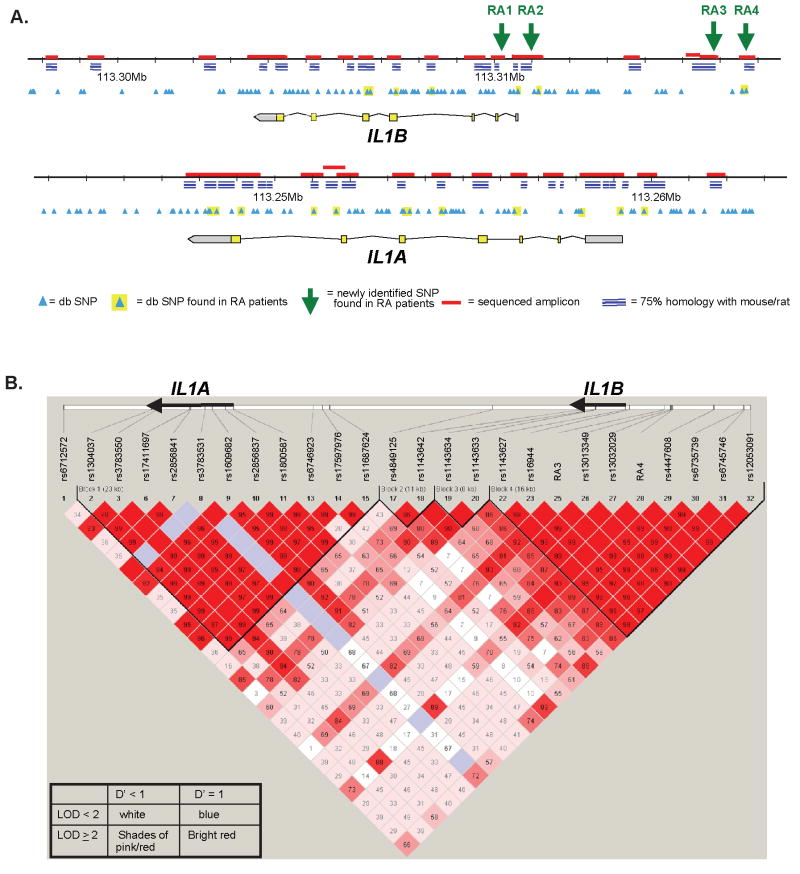
Figure 1.
A. Schematic diagram of the IL1A and IL1B loci. B. Linkage disequilibrium map of the SNPs genotyped in IL1A and IL1B in NARAC, as displayed by the Haploview software package. Haplotype blocks (black lines) are drawn according to confidence intervals (35). D′ values are shown in the boxes.

