
Figure 11.
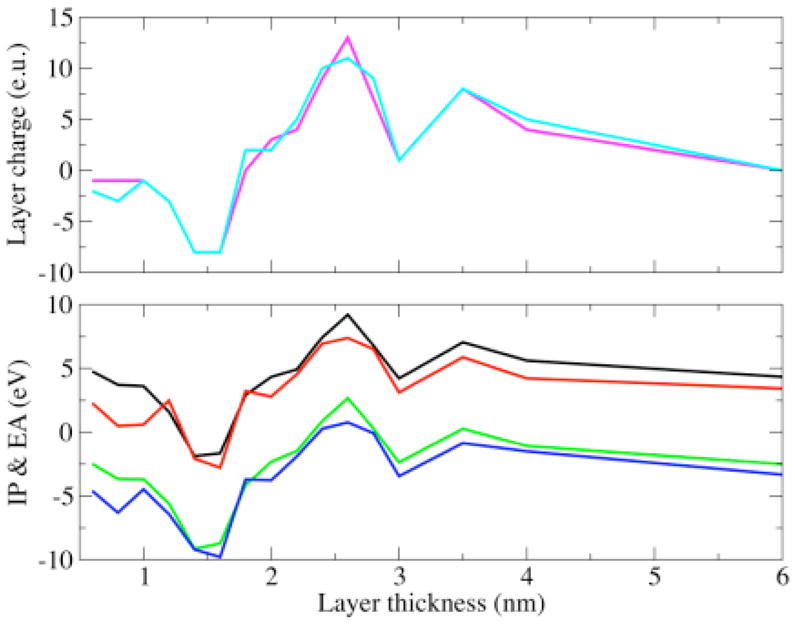
Bottom pane: hypothetical change in the IP and EA of BH4 due to the charge of a protein layer (of certain thickness) around BH4: IP of BH4 bound to chain A (black curve), IP of BH4 bound to chain B (red curve), EA of BH4 bound to chain A (green curve), EA of BH4 bound to chain B (blue curve), Top pane: Variation of the charge on the protein layer (of certain thickness) around BH4: total charge on the protein layer around BH4 bound to chain A (magenta curve), total charge on the protein layer around BH4 bound to chain B (cyan curve).